By downloading any image and using it (possibly modified) in future publications, presentations, lectures and similar,
you undertake to give credit to the authors as appropriate.
By downloading any image and using it (possibly modified) in future publications, presentations, lectures and similar,
you undertake to give credit to the authors as appropriate.
By downloading any image and using it (possibly modified) in future publications, presentations, lectures and similar,
you undertake to give credit to the authors as appropriate.
By downloading any image and using it (possibly modified) in future publications, presentations, lectures and similar,
you undertake to give credit to the authors as appropriate.
By downloading any image and using it (possibly modified) in future publications, presentations, lectures and similar,
you undertake to give credit to the authors as appropriate.
By downloading any image and using it (possibly modified) in future publications, presentations, lectures and similar,
you undertake to give credit to the authors as appropriate.
By downloading any image and using it (possibly modified) in future publications, presentations, lectures and similar,
you undertake to give credit to the authors as appropriate.
By downloading any image and using it (possibly modified) in future publications, presentations, lectures and similar,
you undertake to give credit to the authors as appropriate.
By downloading any image and using it (possibly modified) in future publications, presentations, lectures and similar,
you undertake to give credit to the authors as appropriate.
By downloading any image and using it (possibly modified) in future publications, presentations, lectures and similar,
you undertake to give credit to the authors as appropriate.
By downloading any image and using it (possibly modified) in future publications, presentations, lectures and similar,
you undertake to give credit to the authors as appropriate.
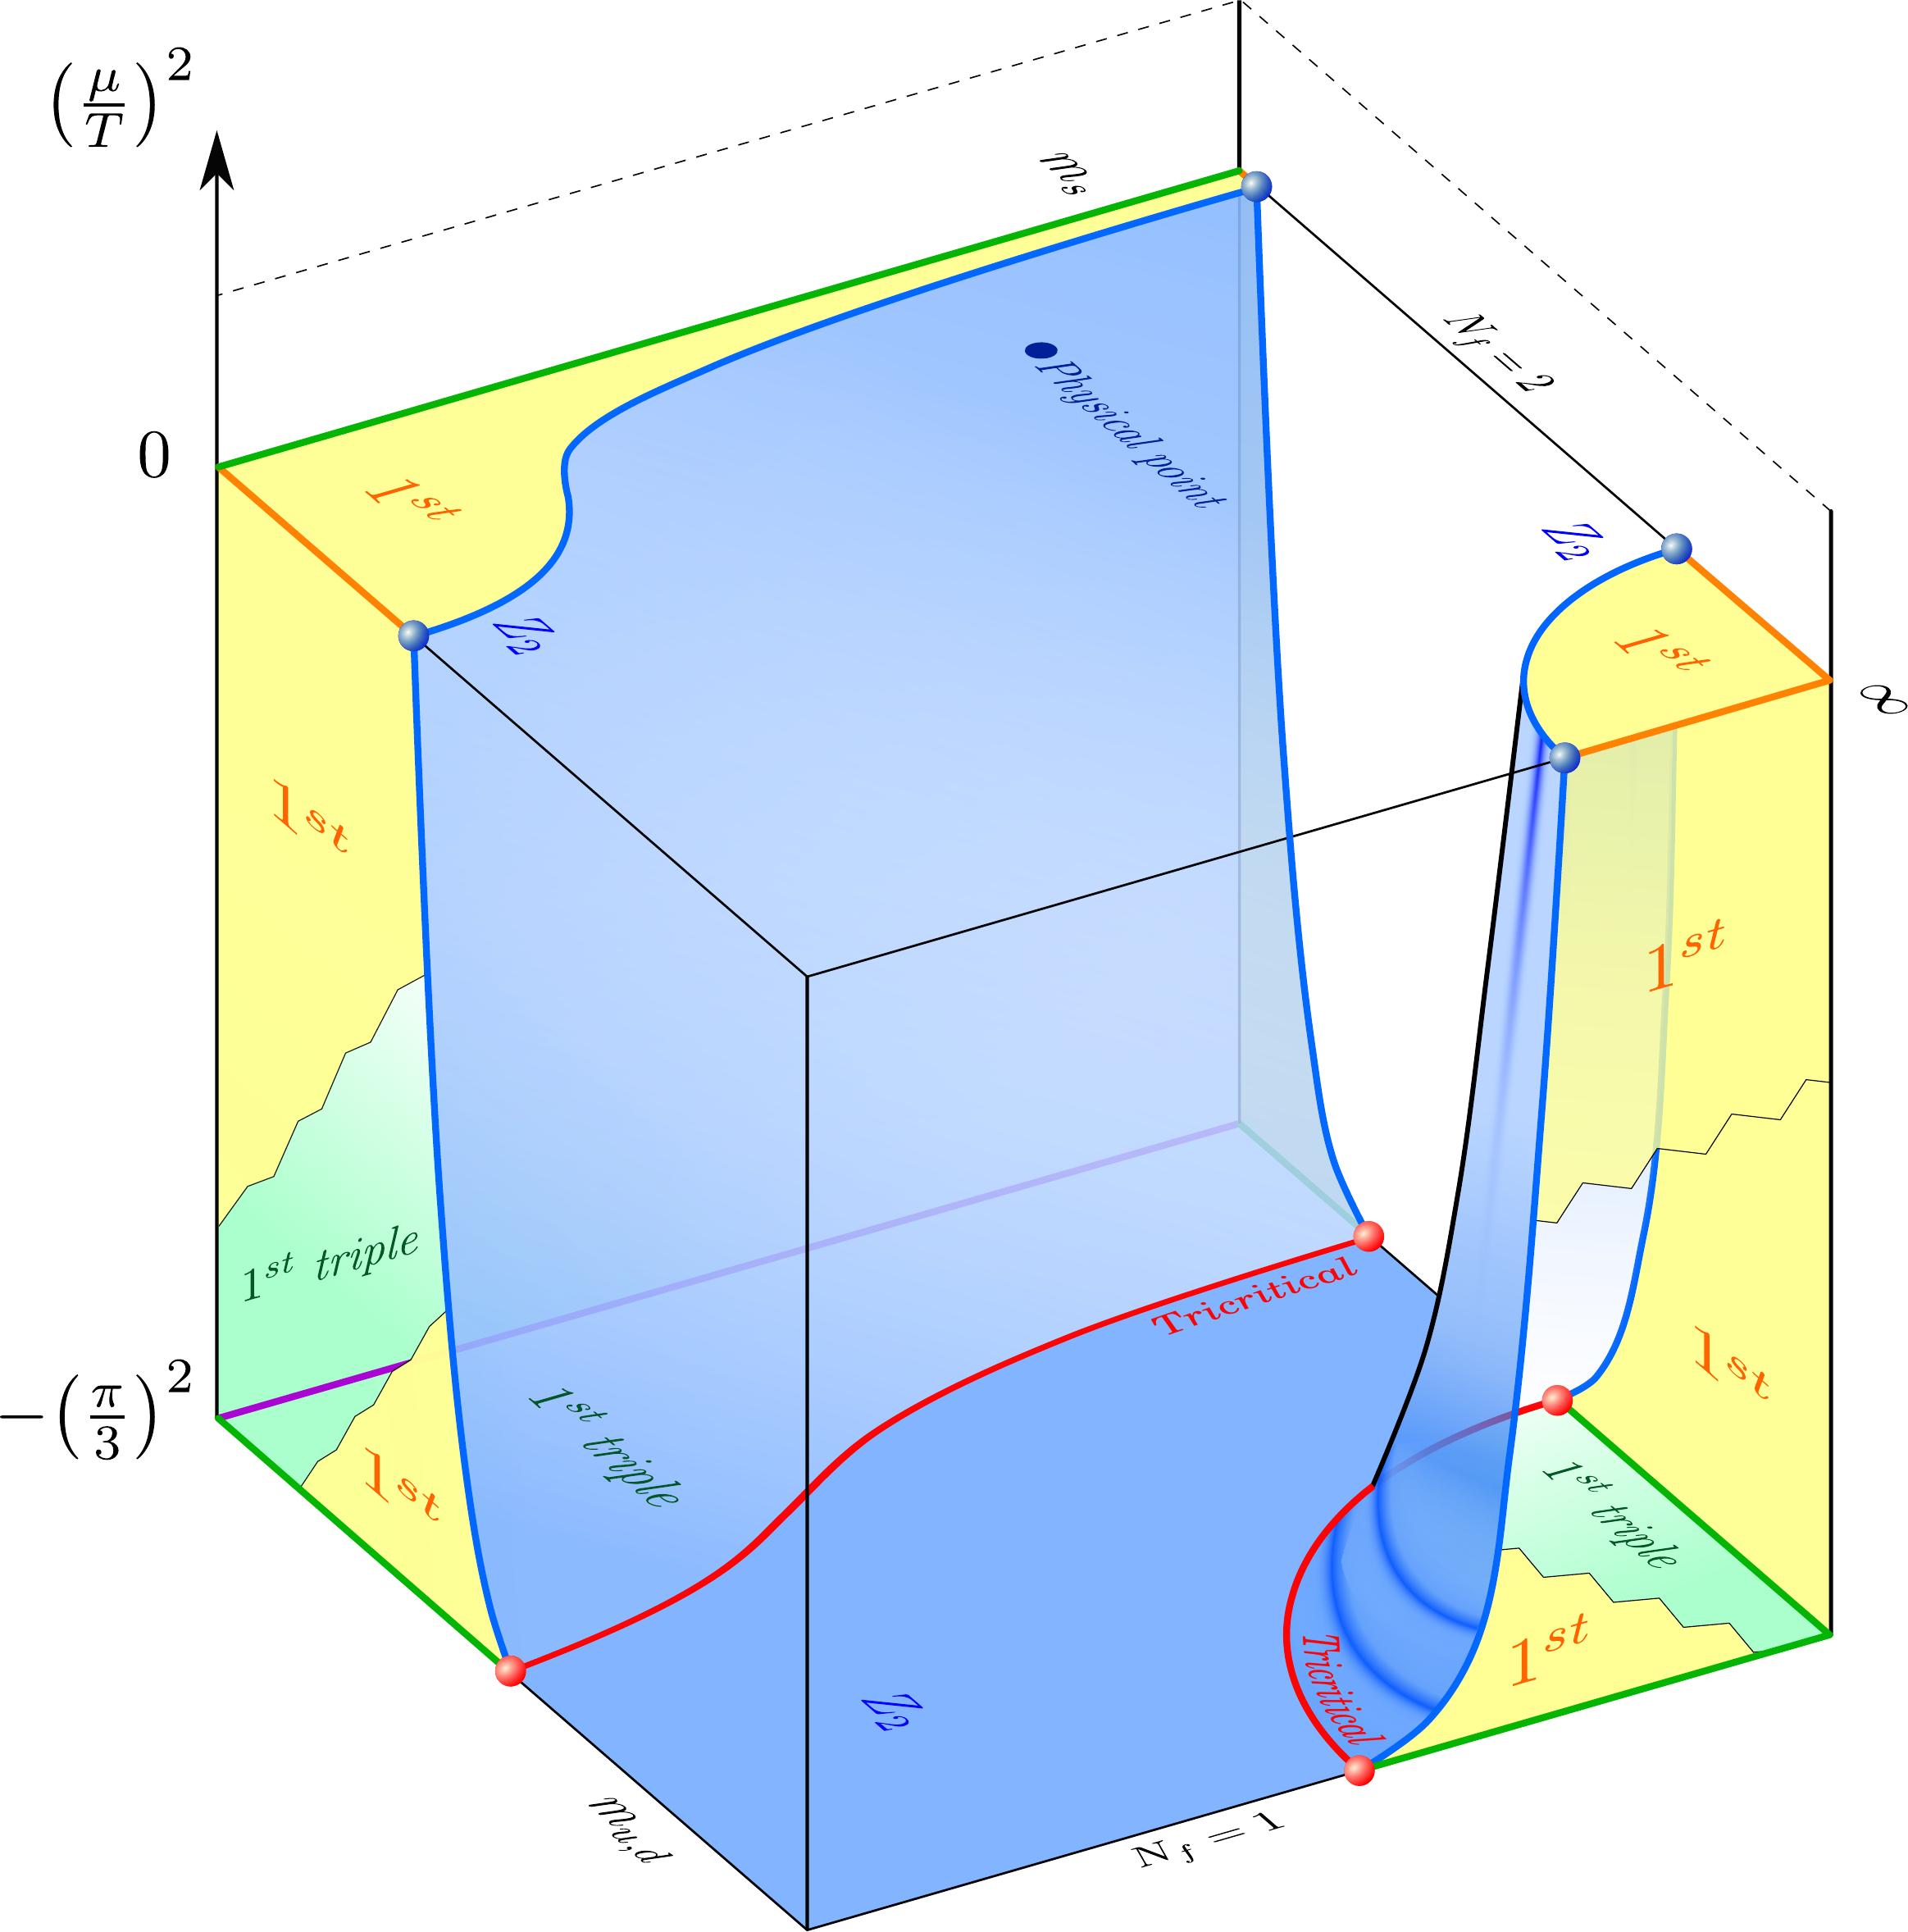
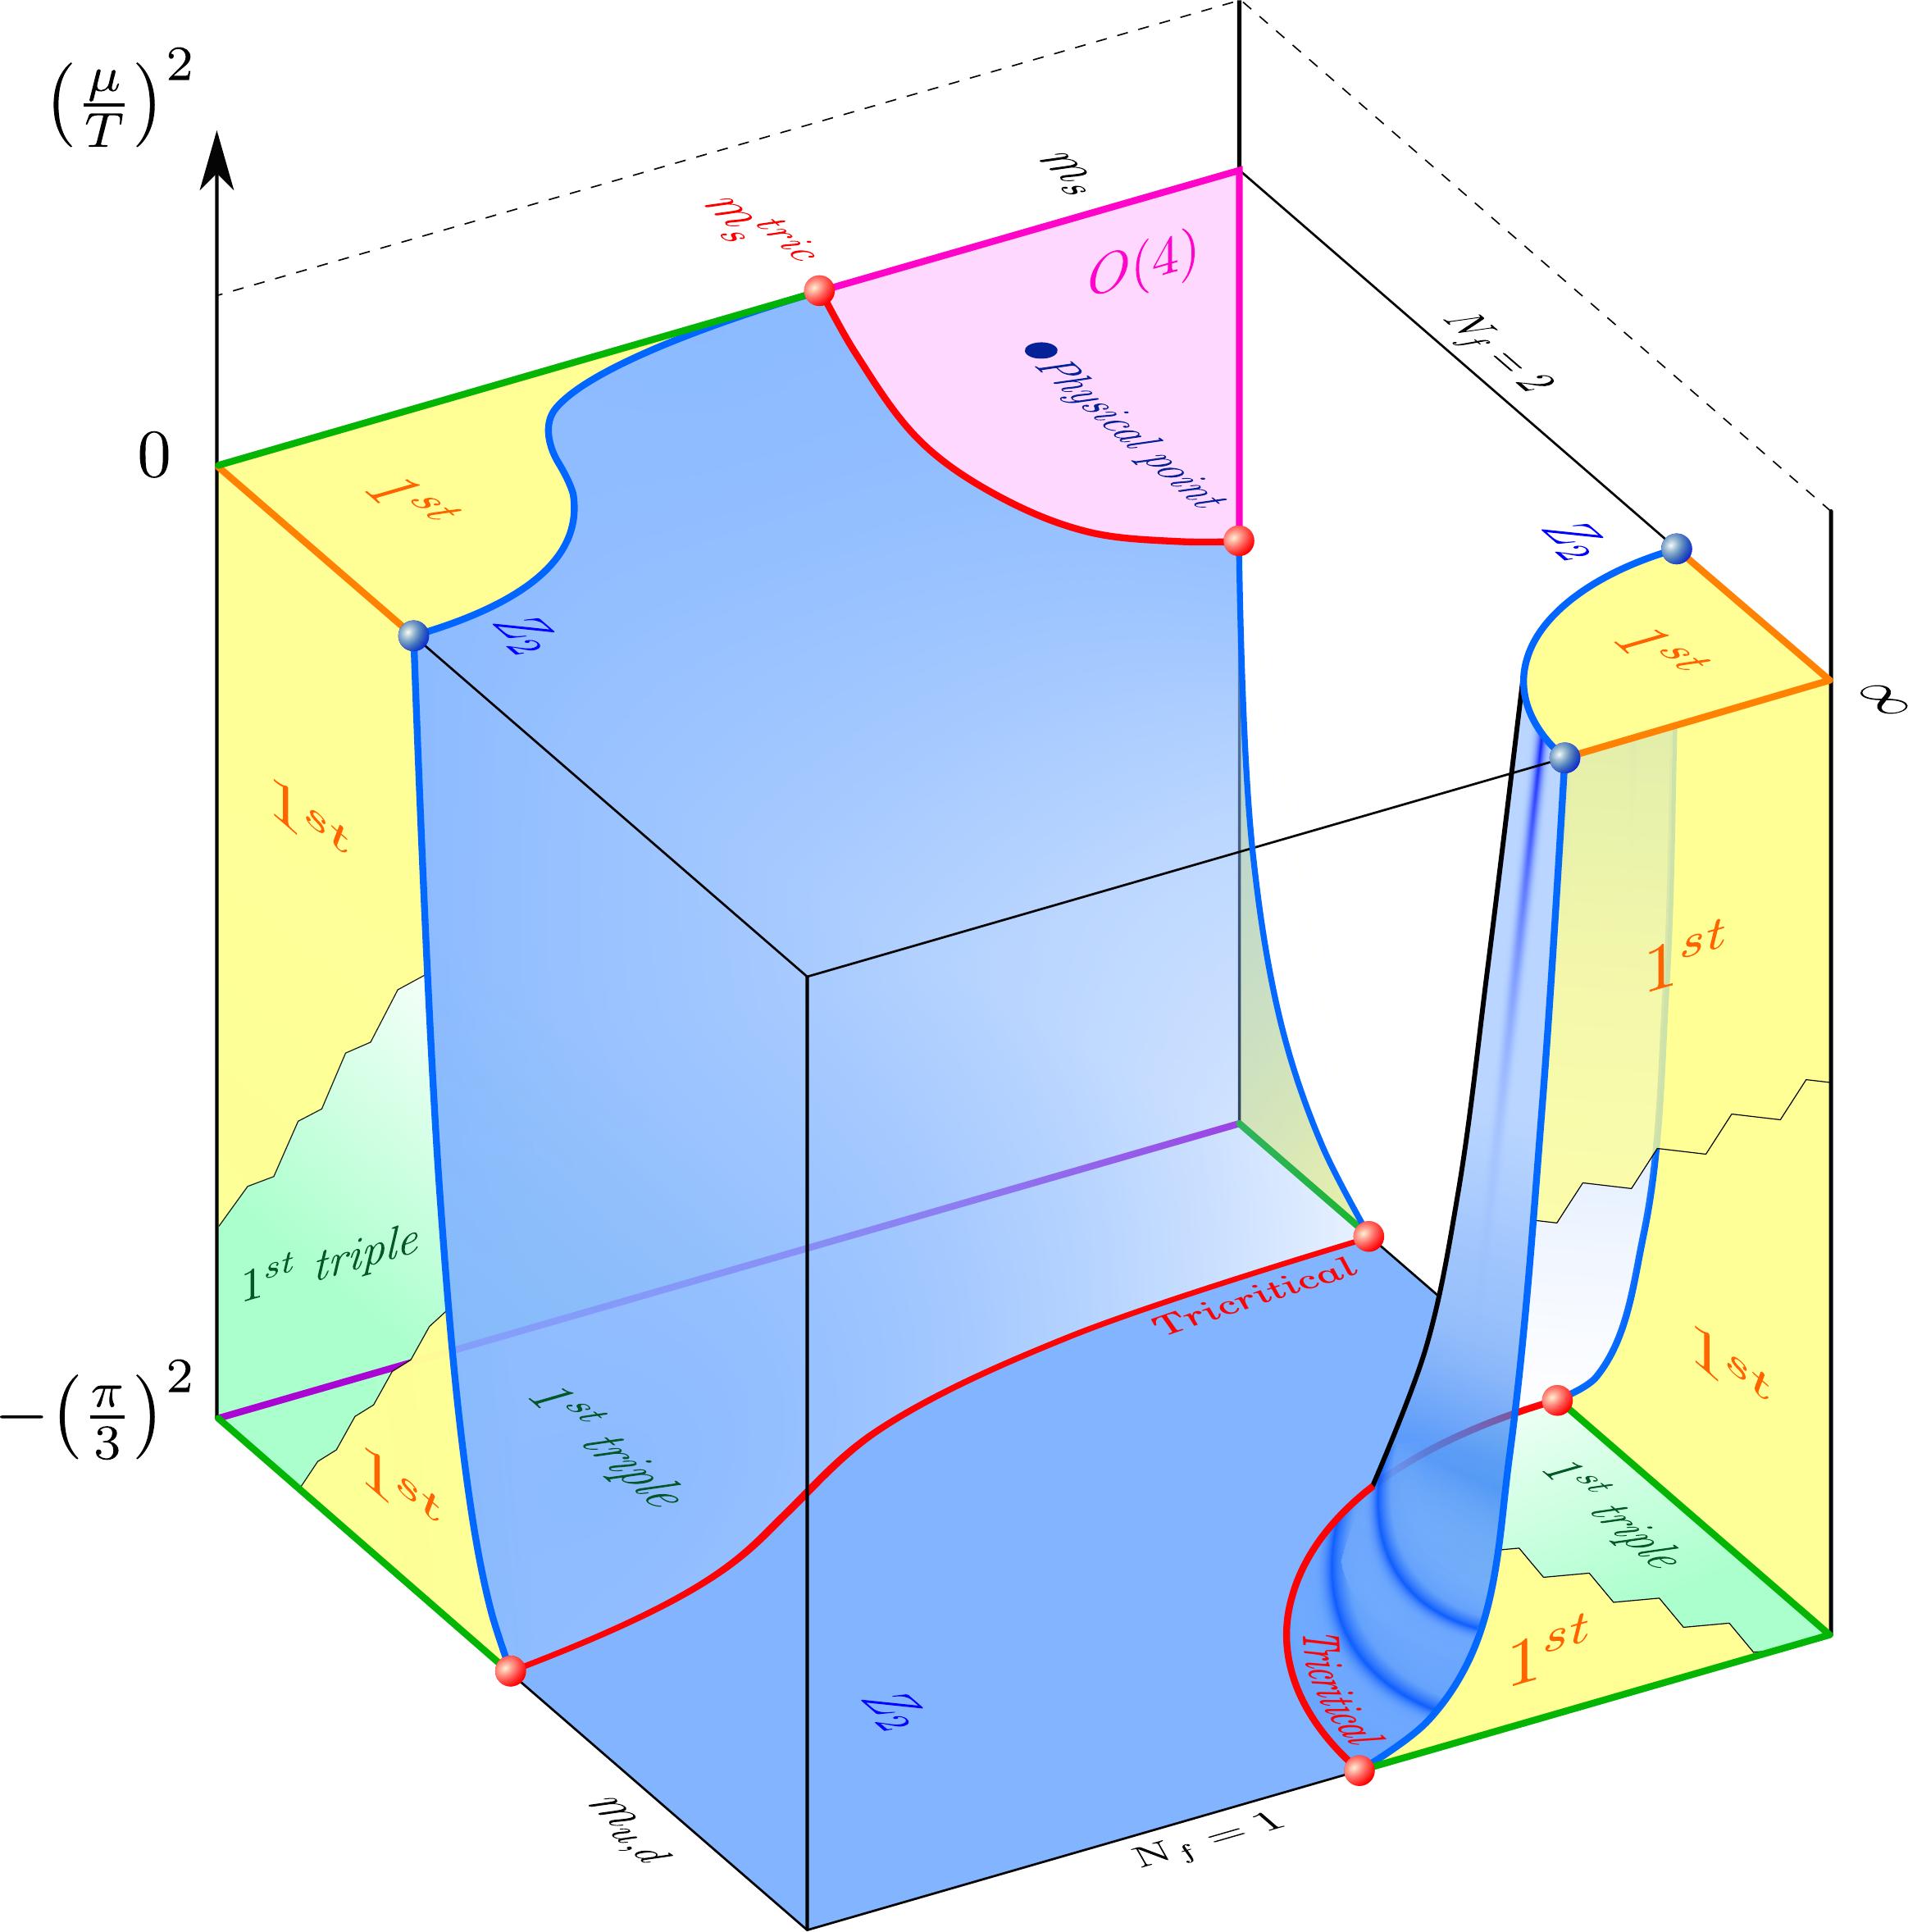
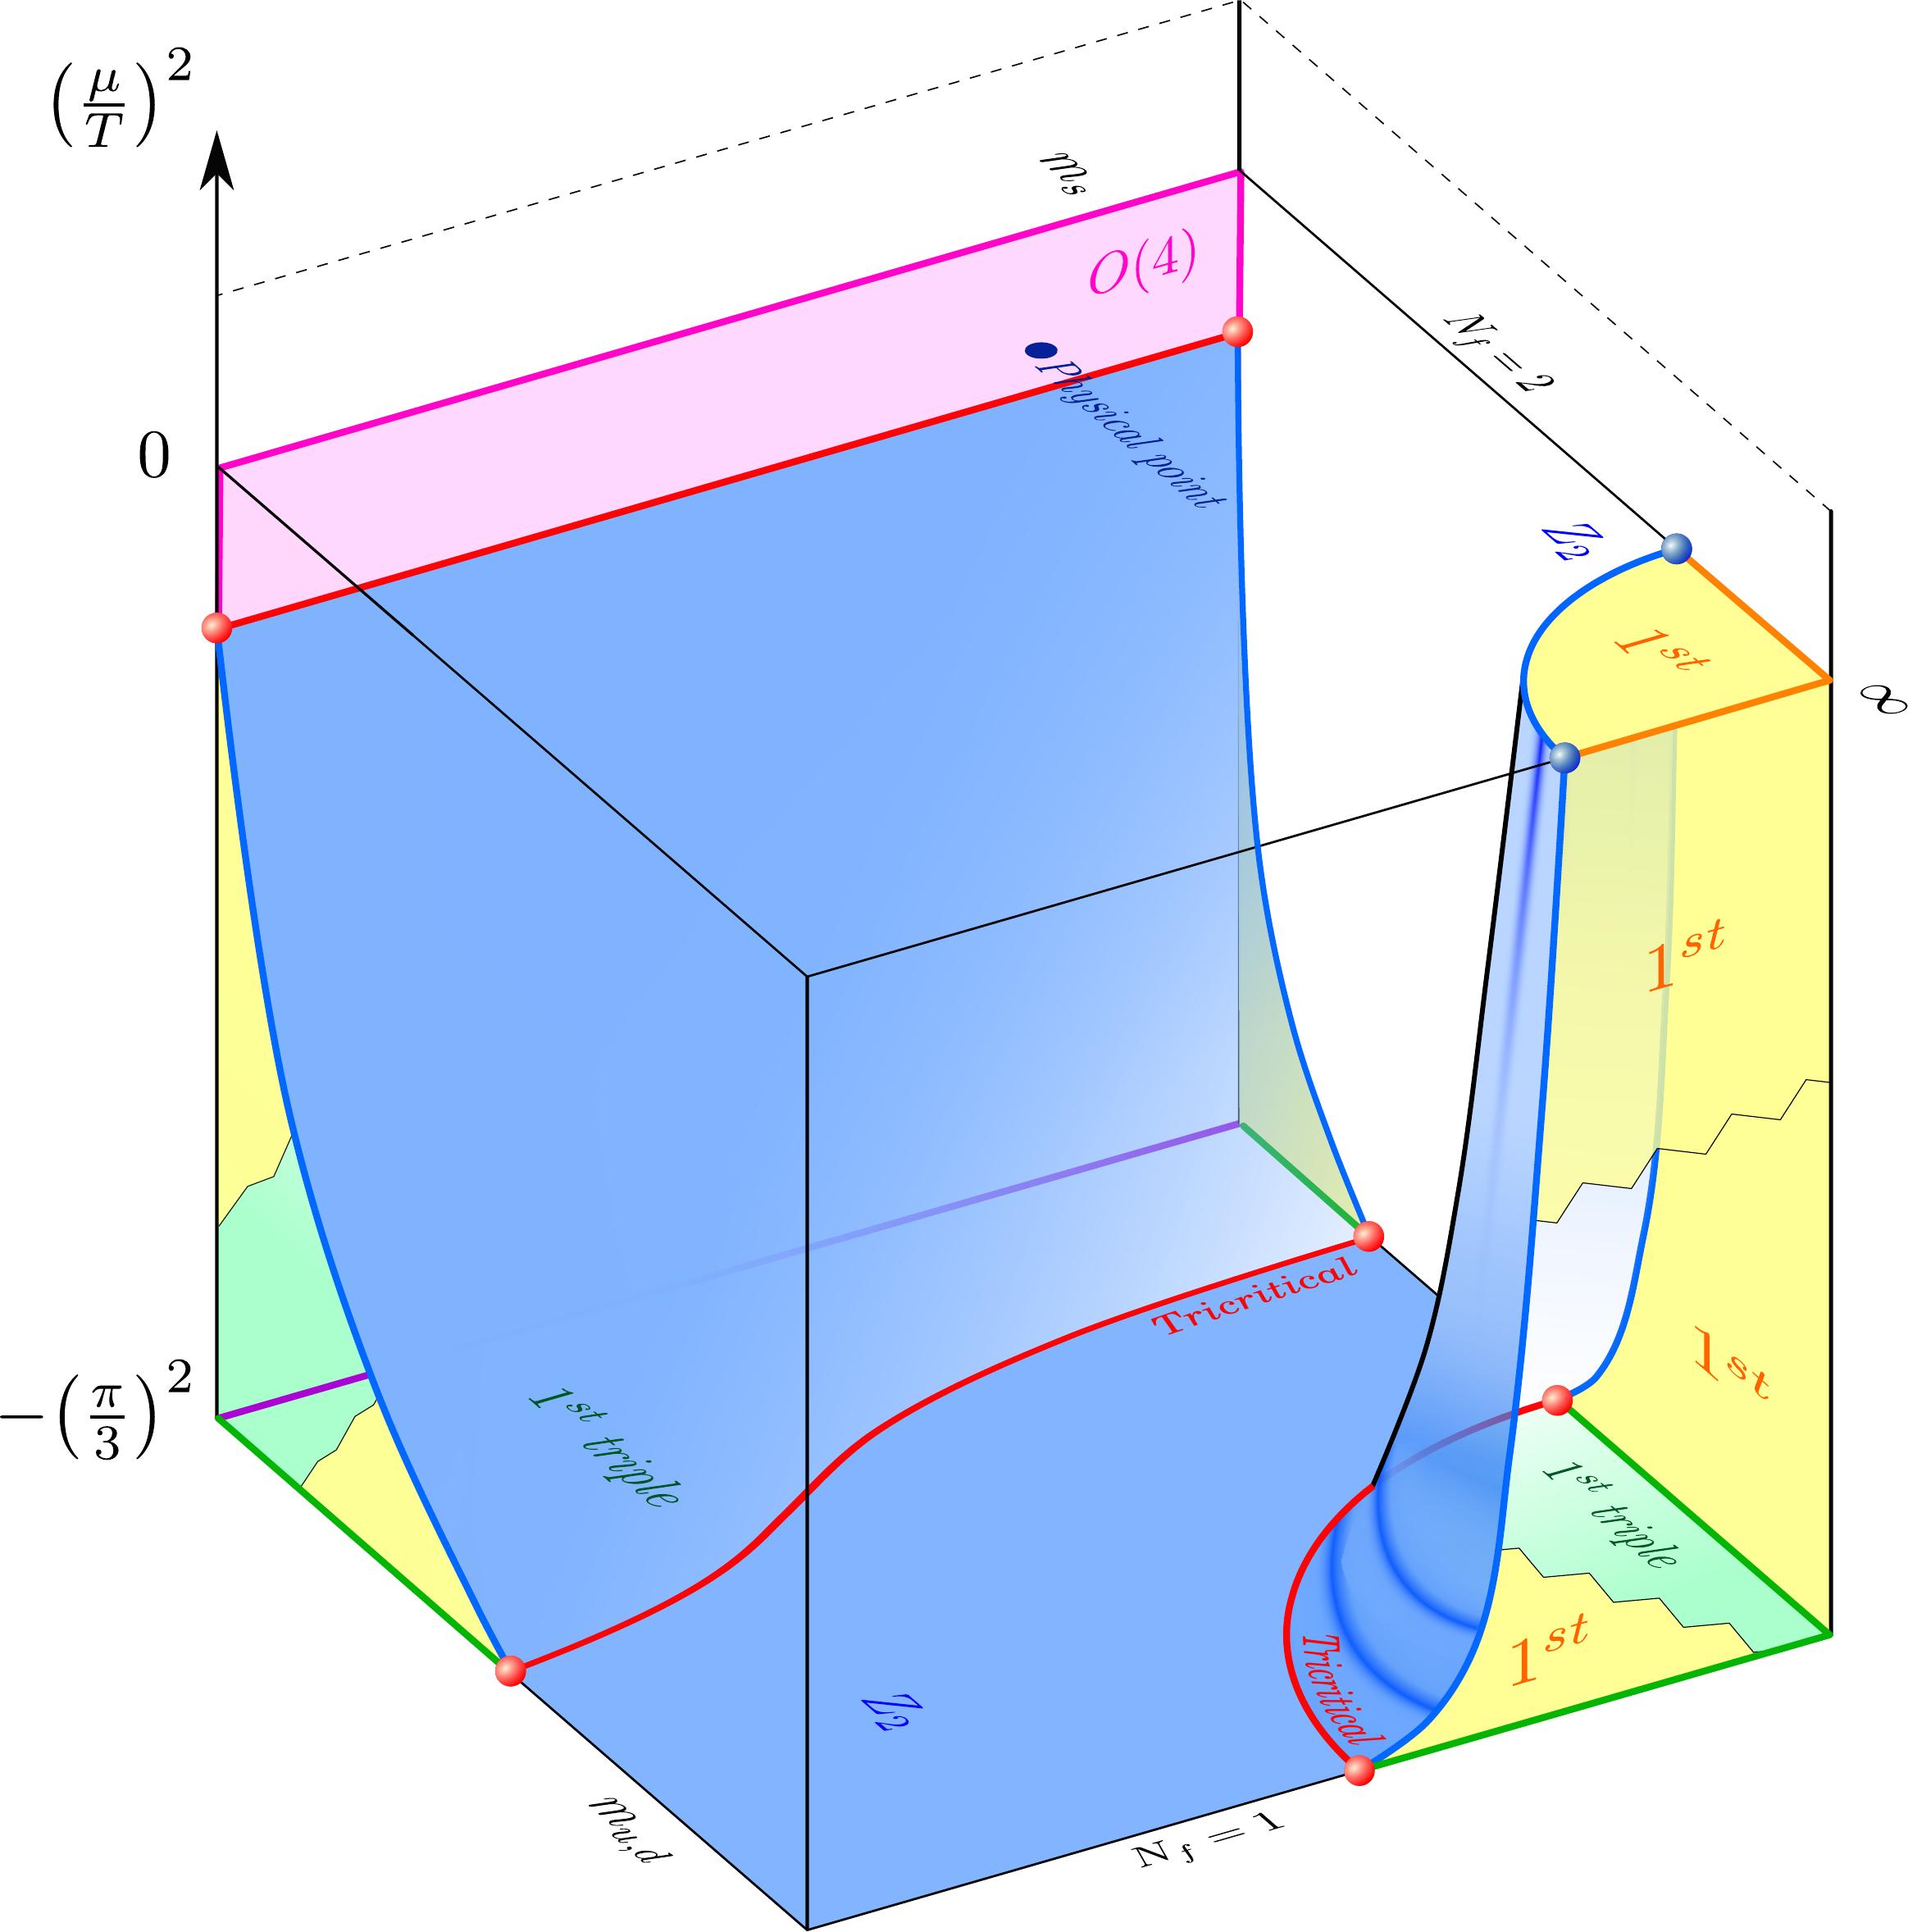
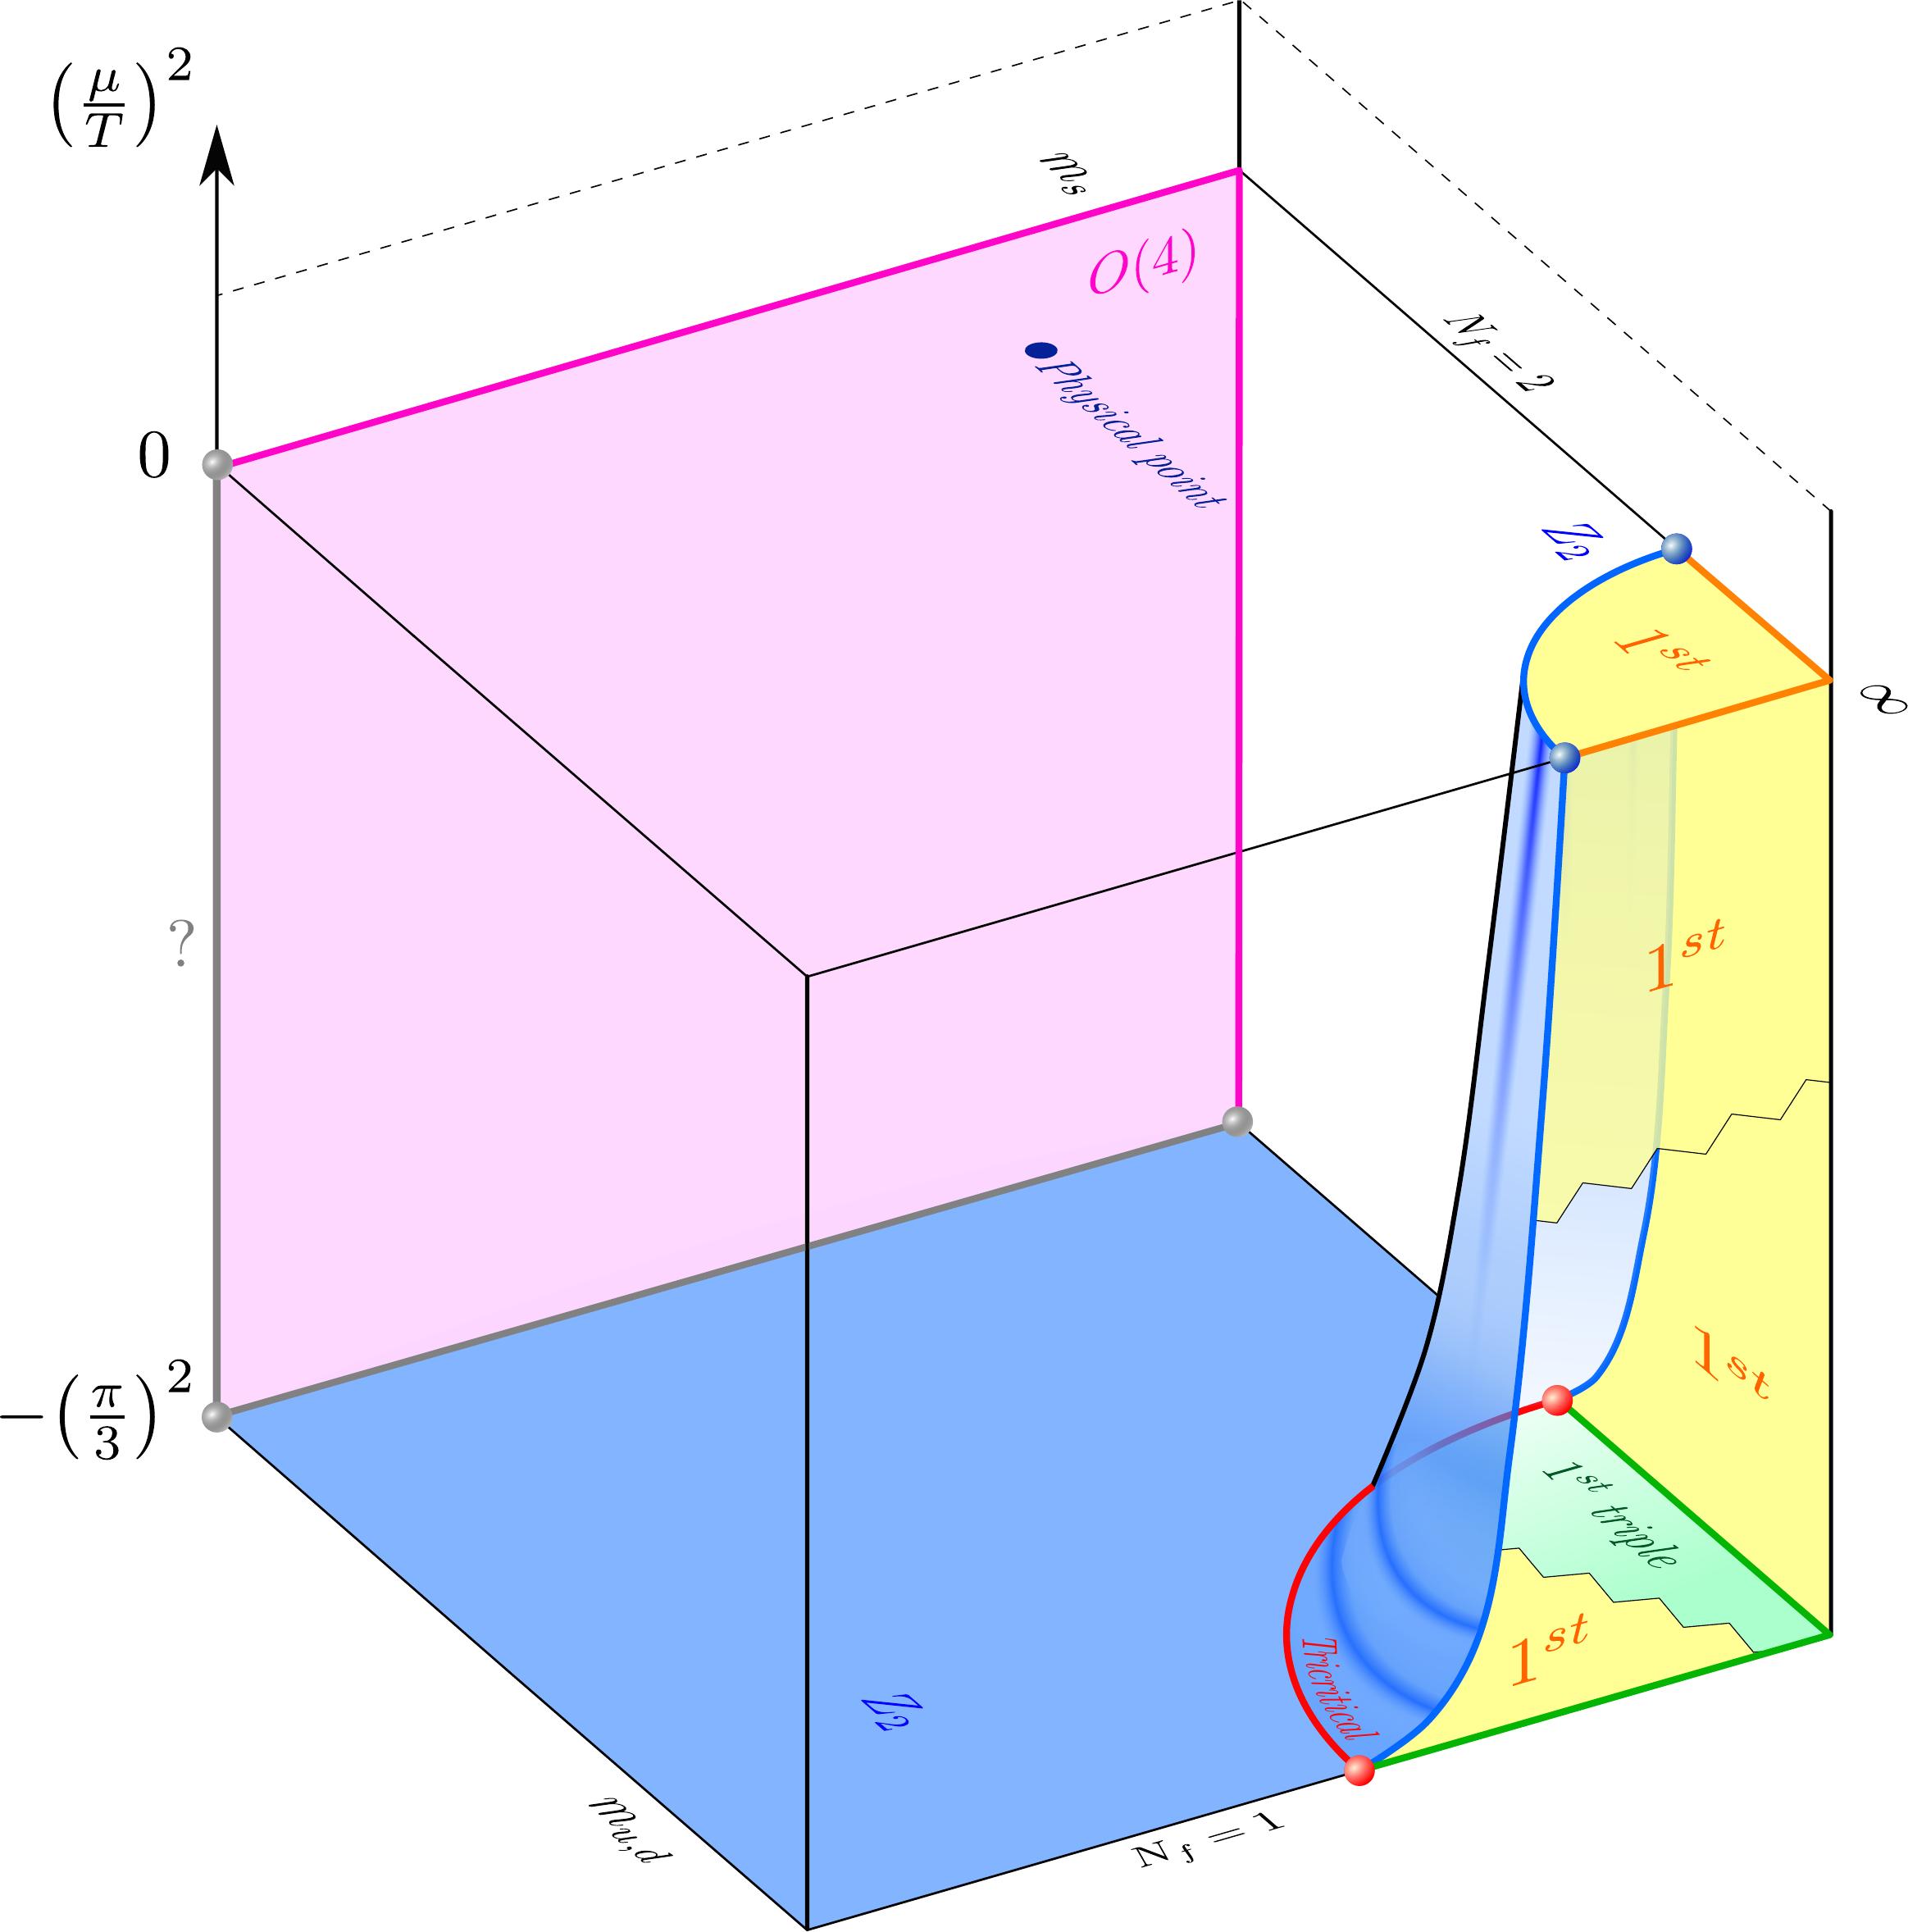
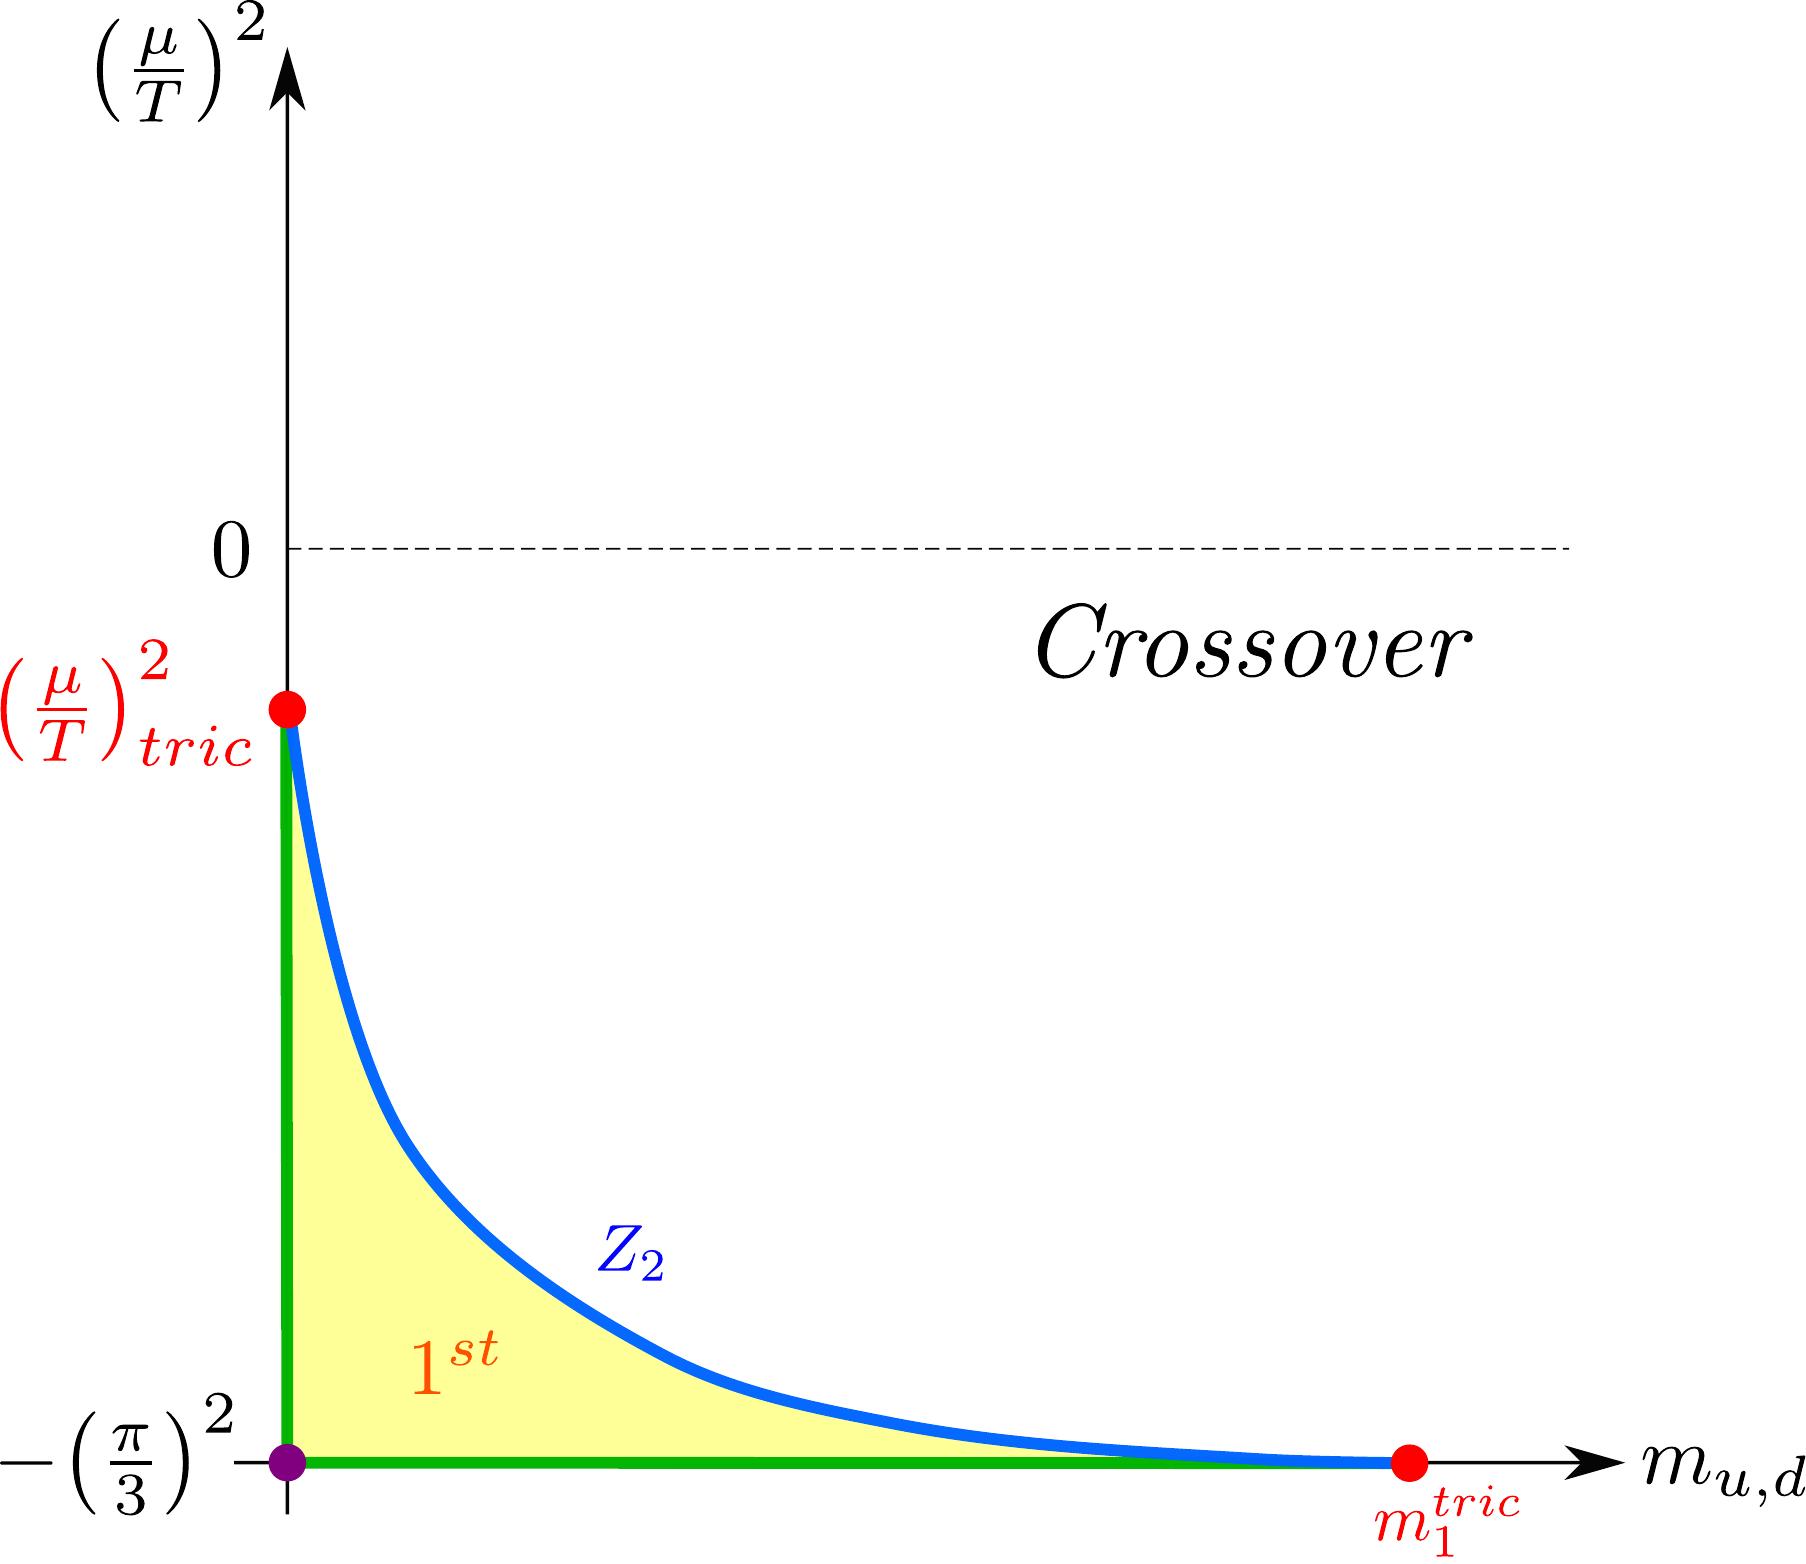
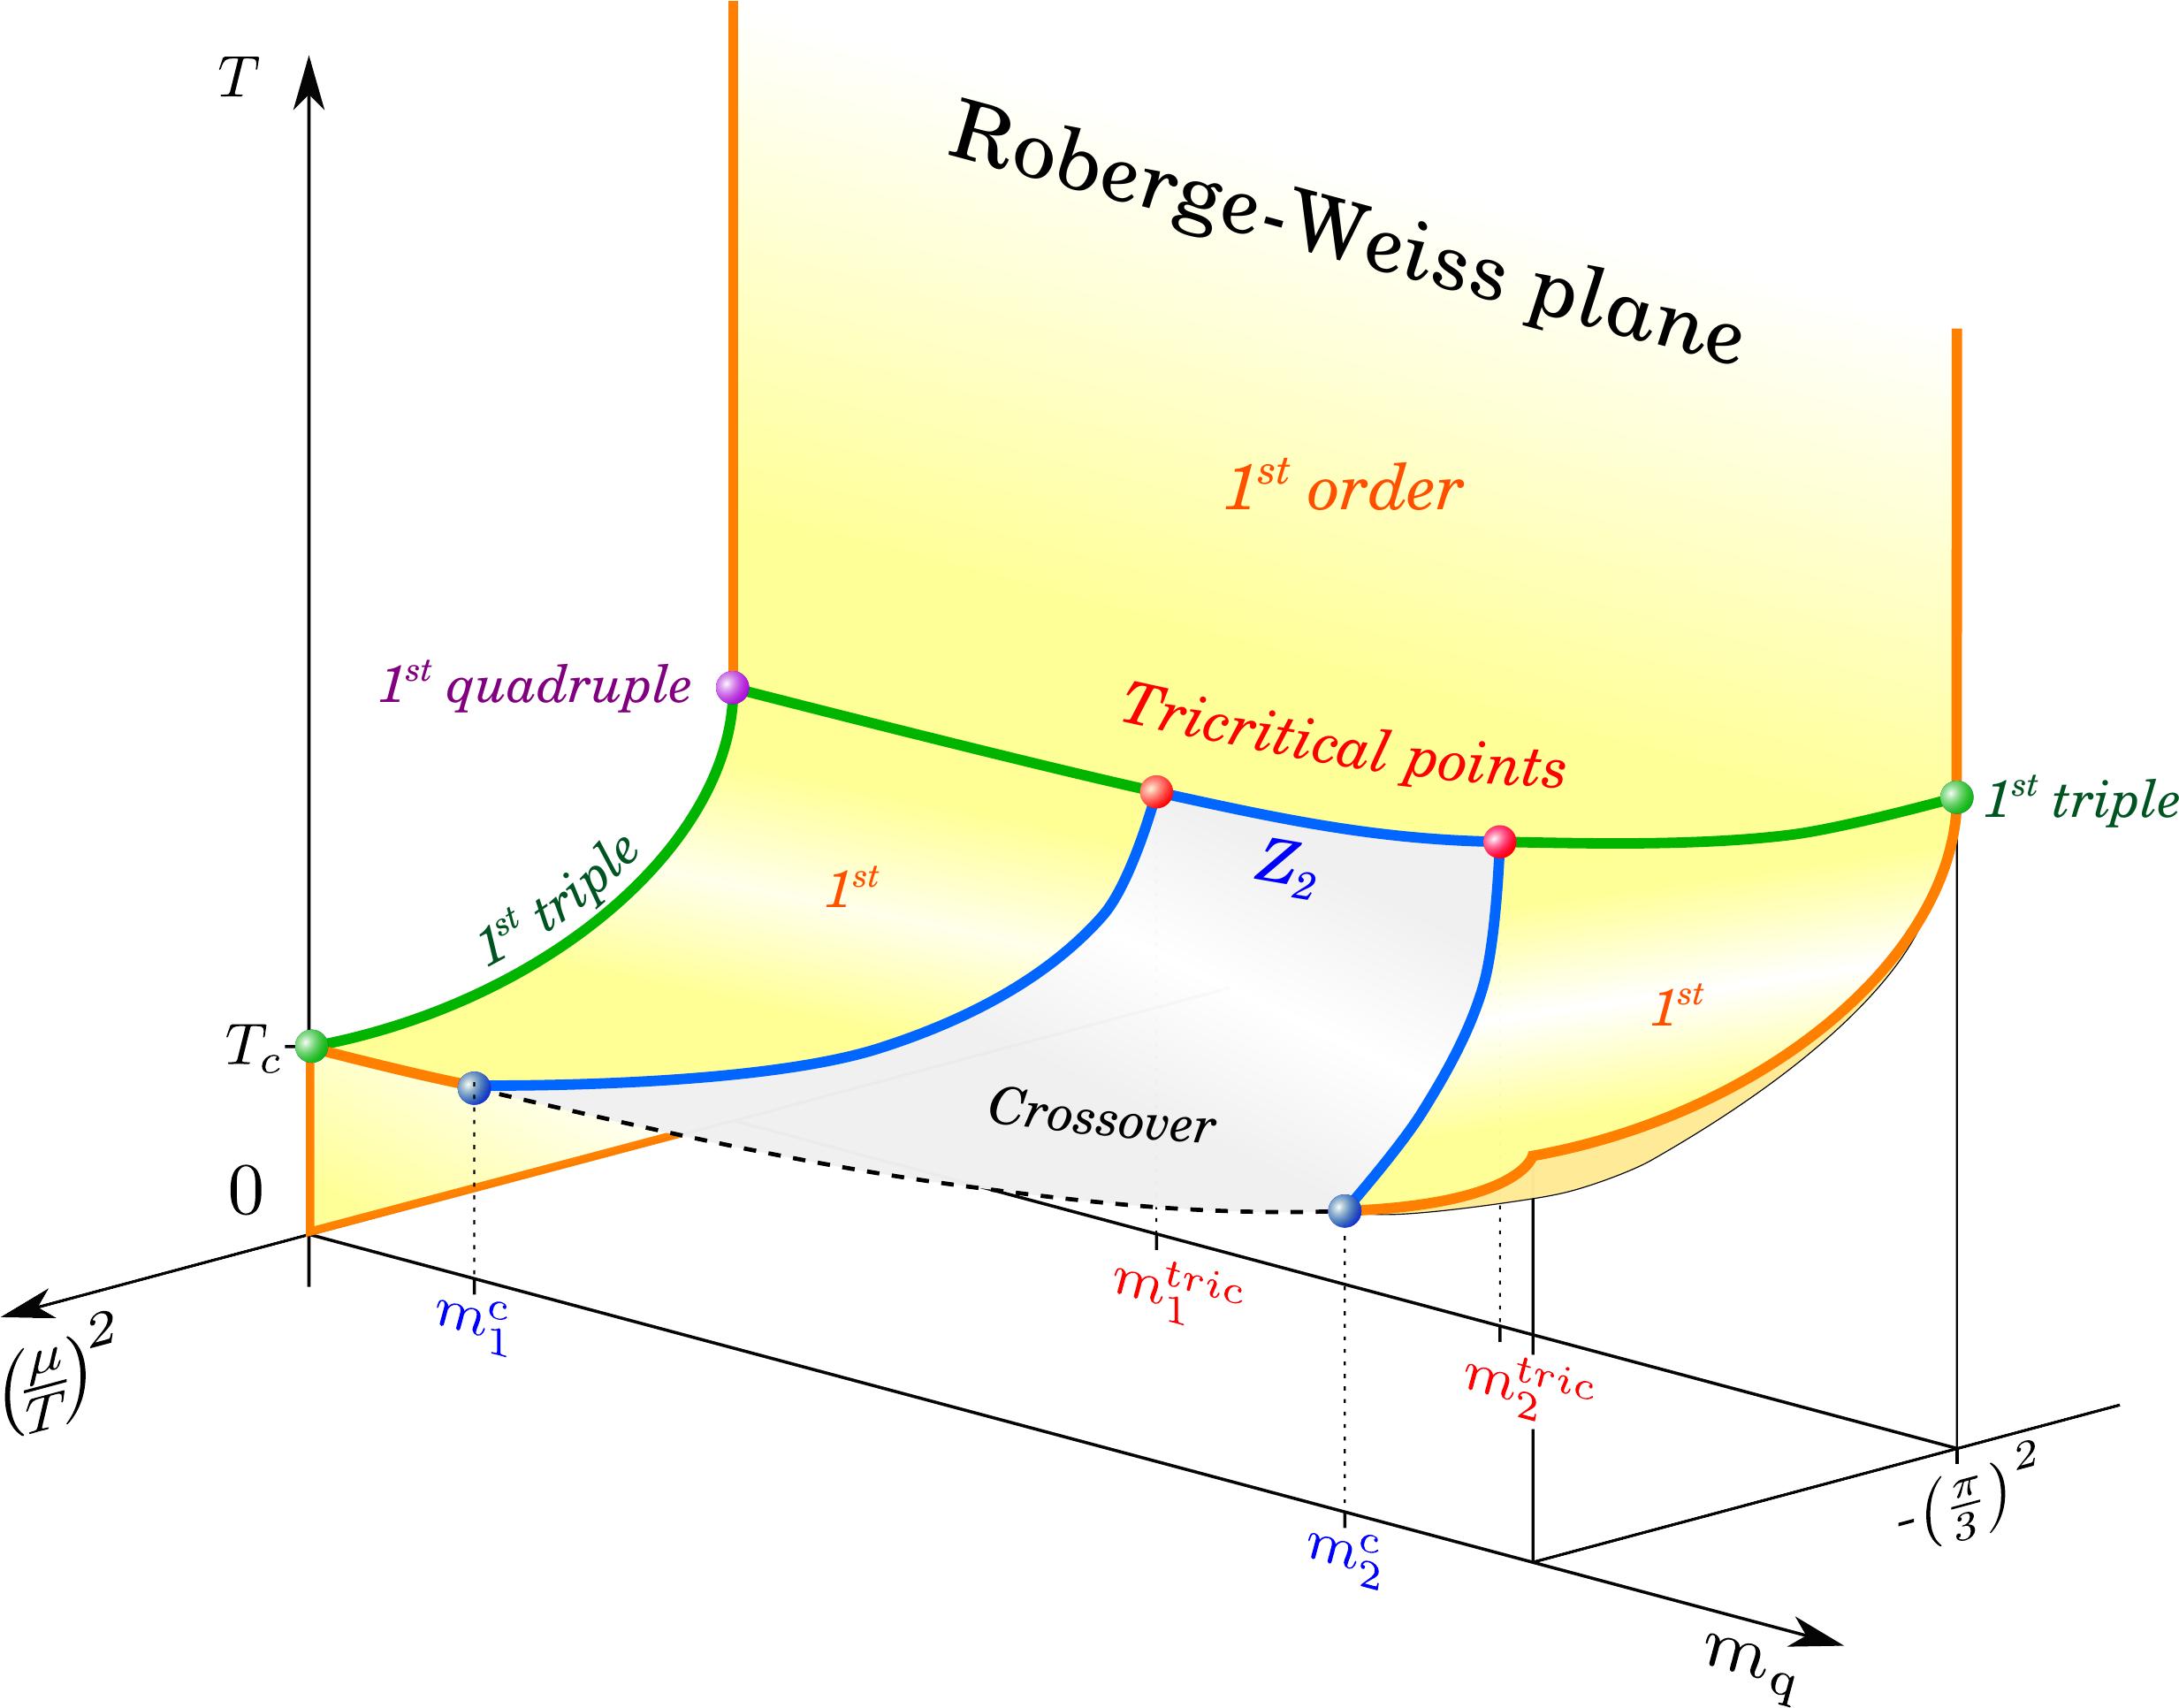
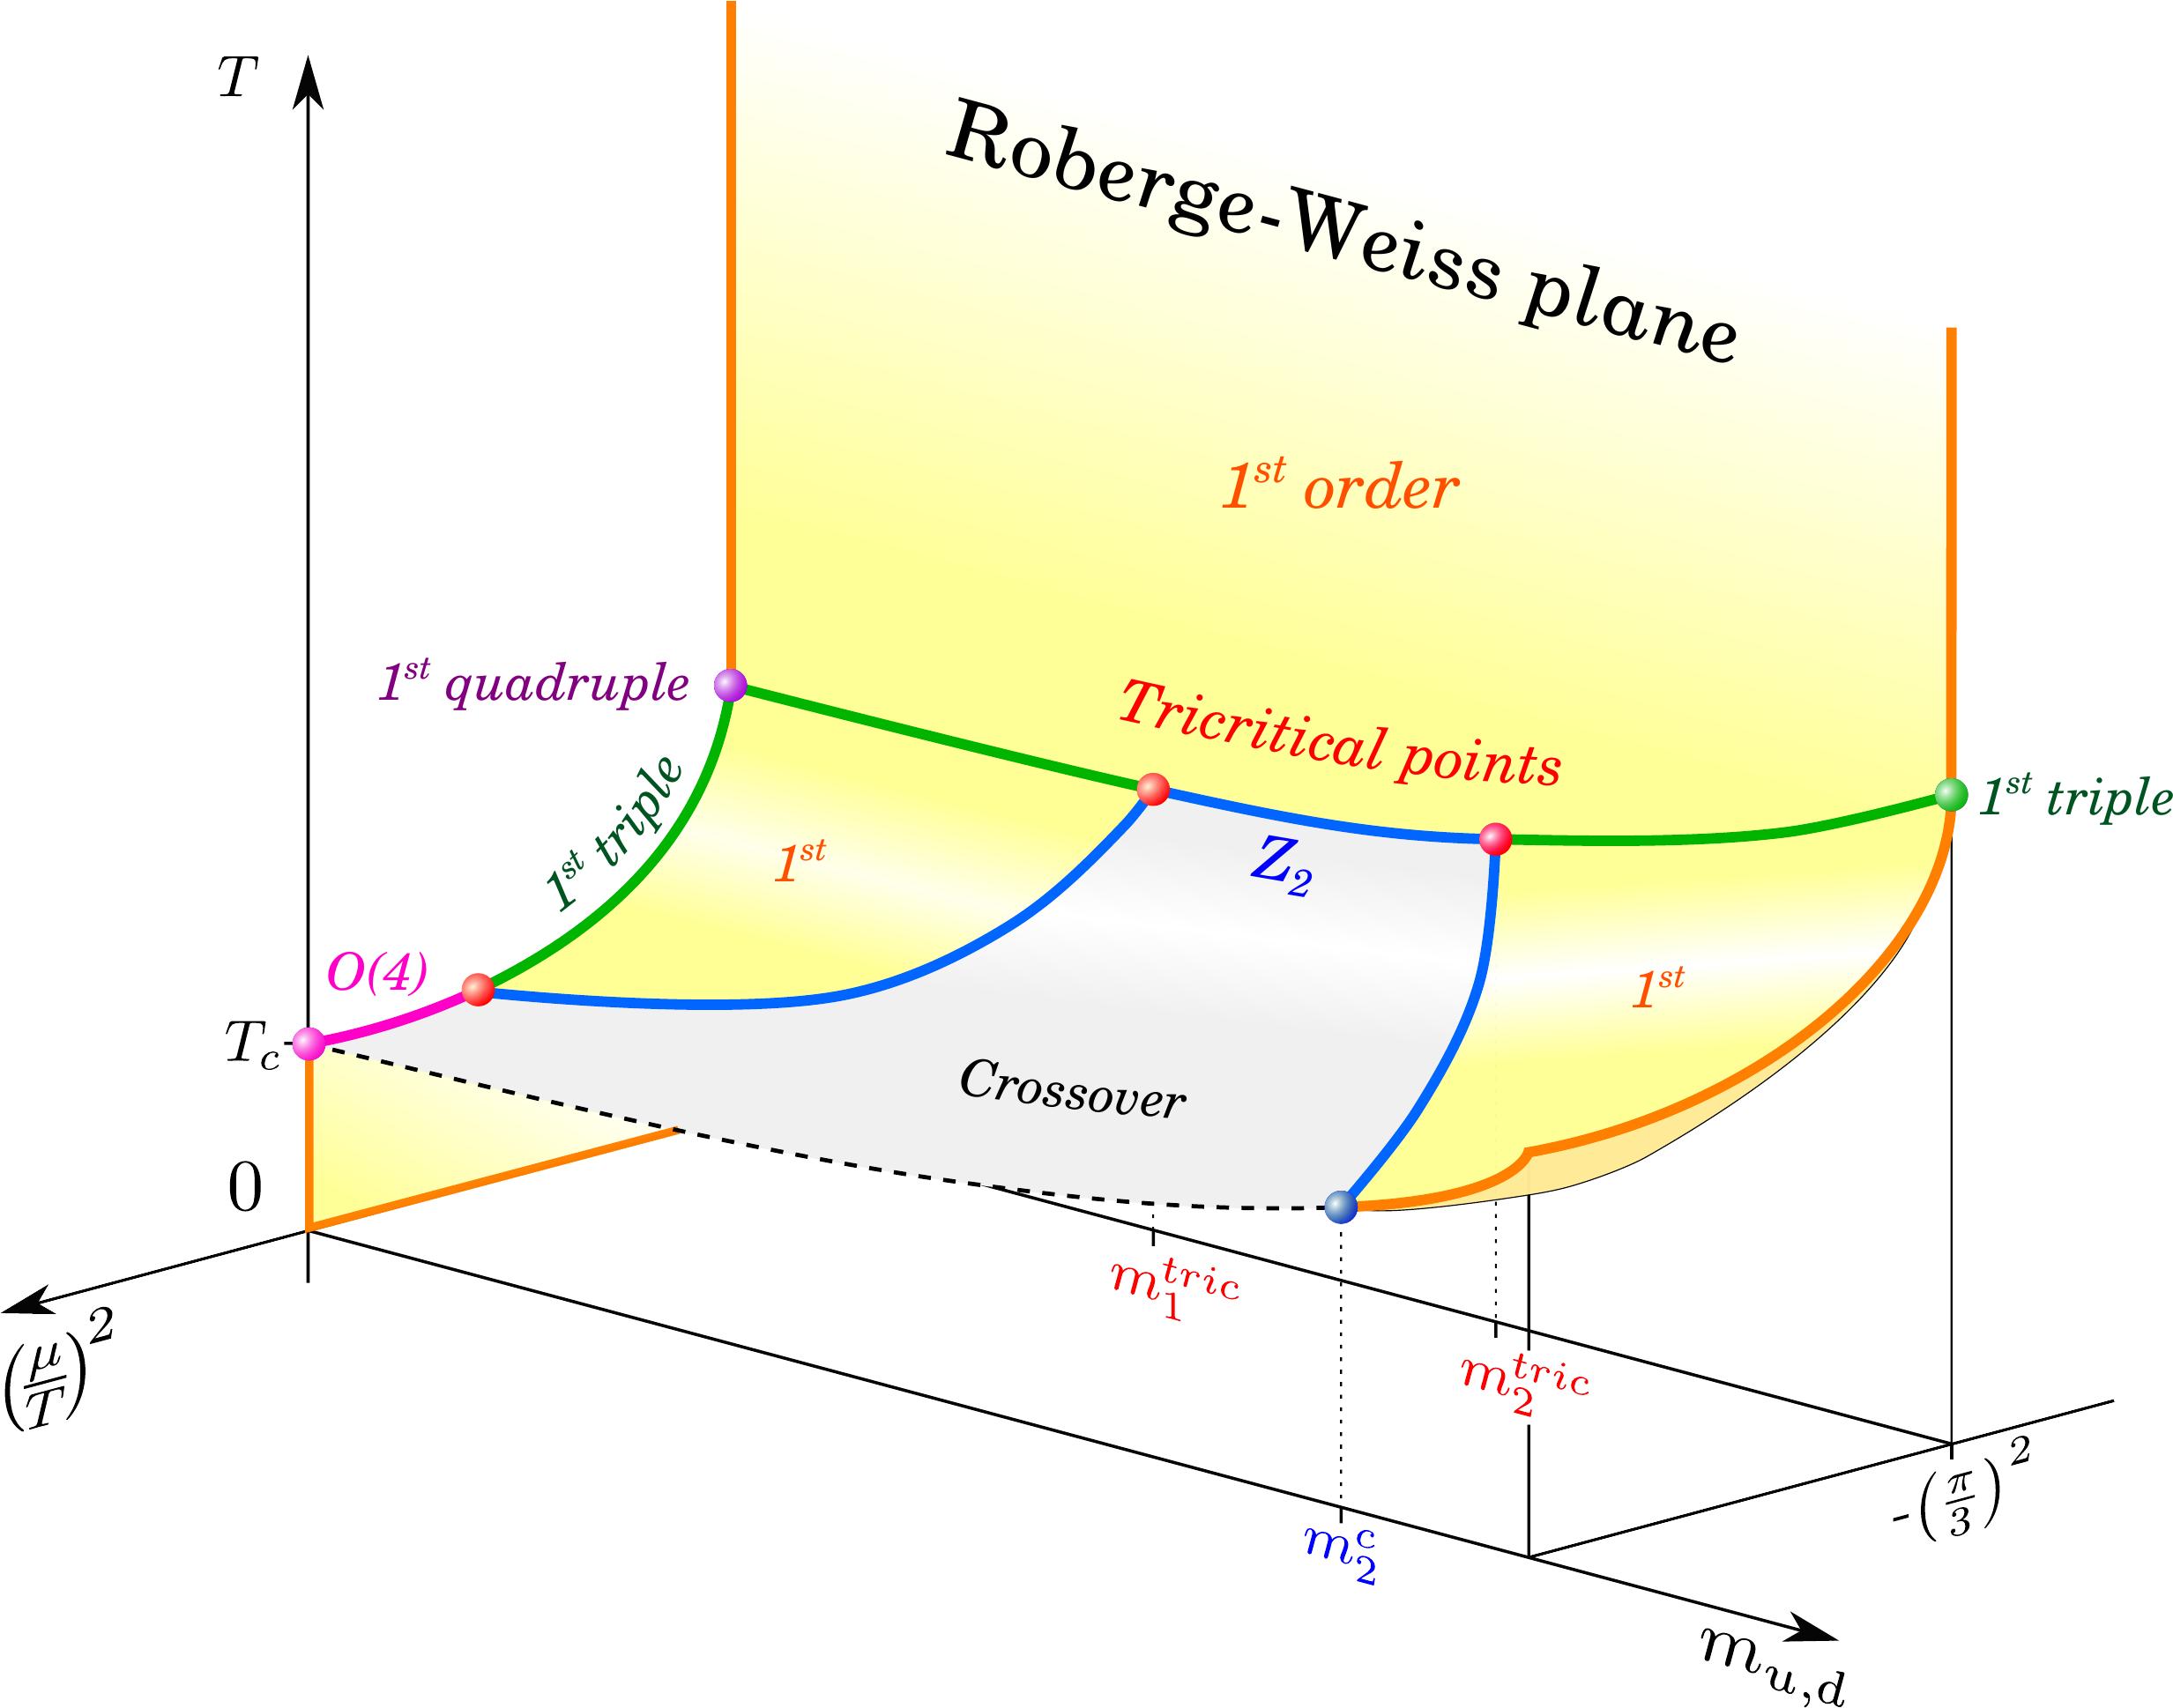
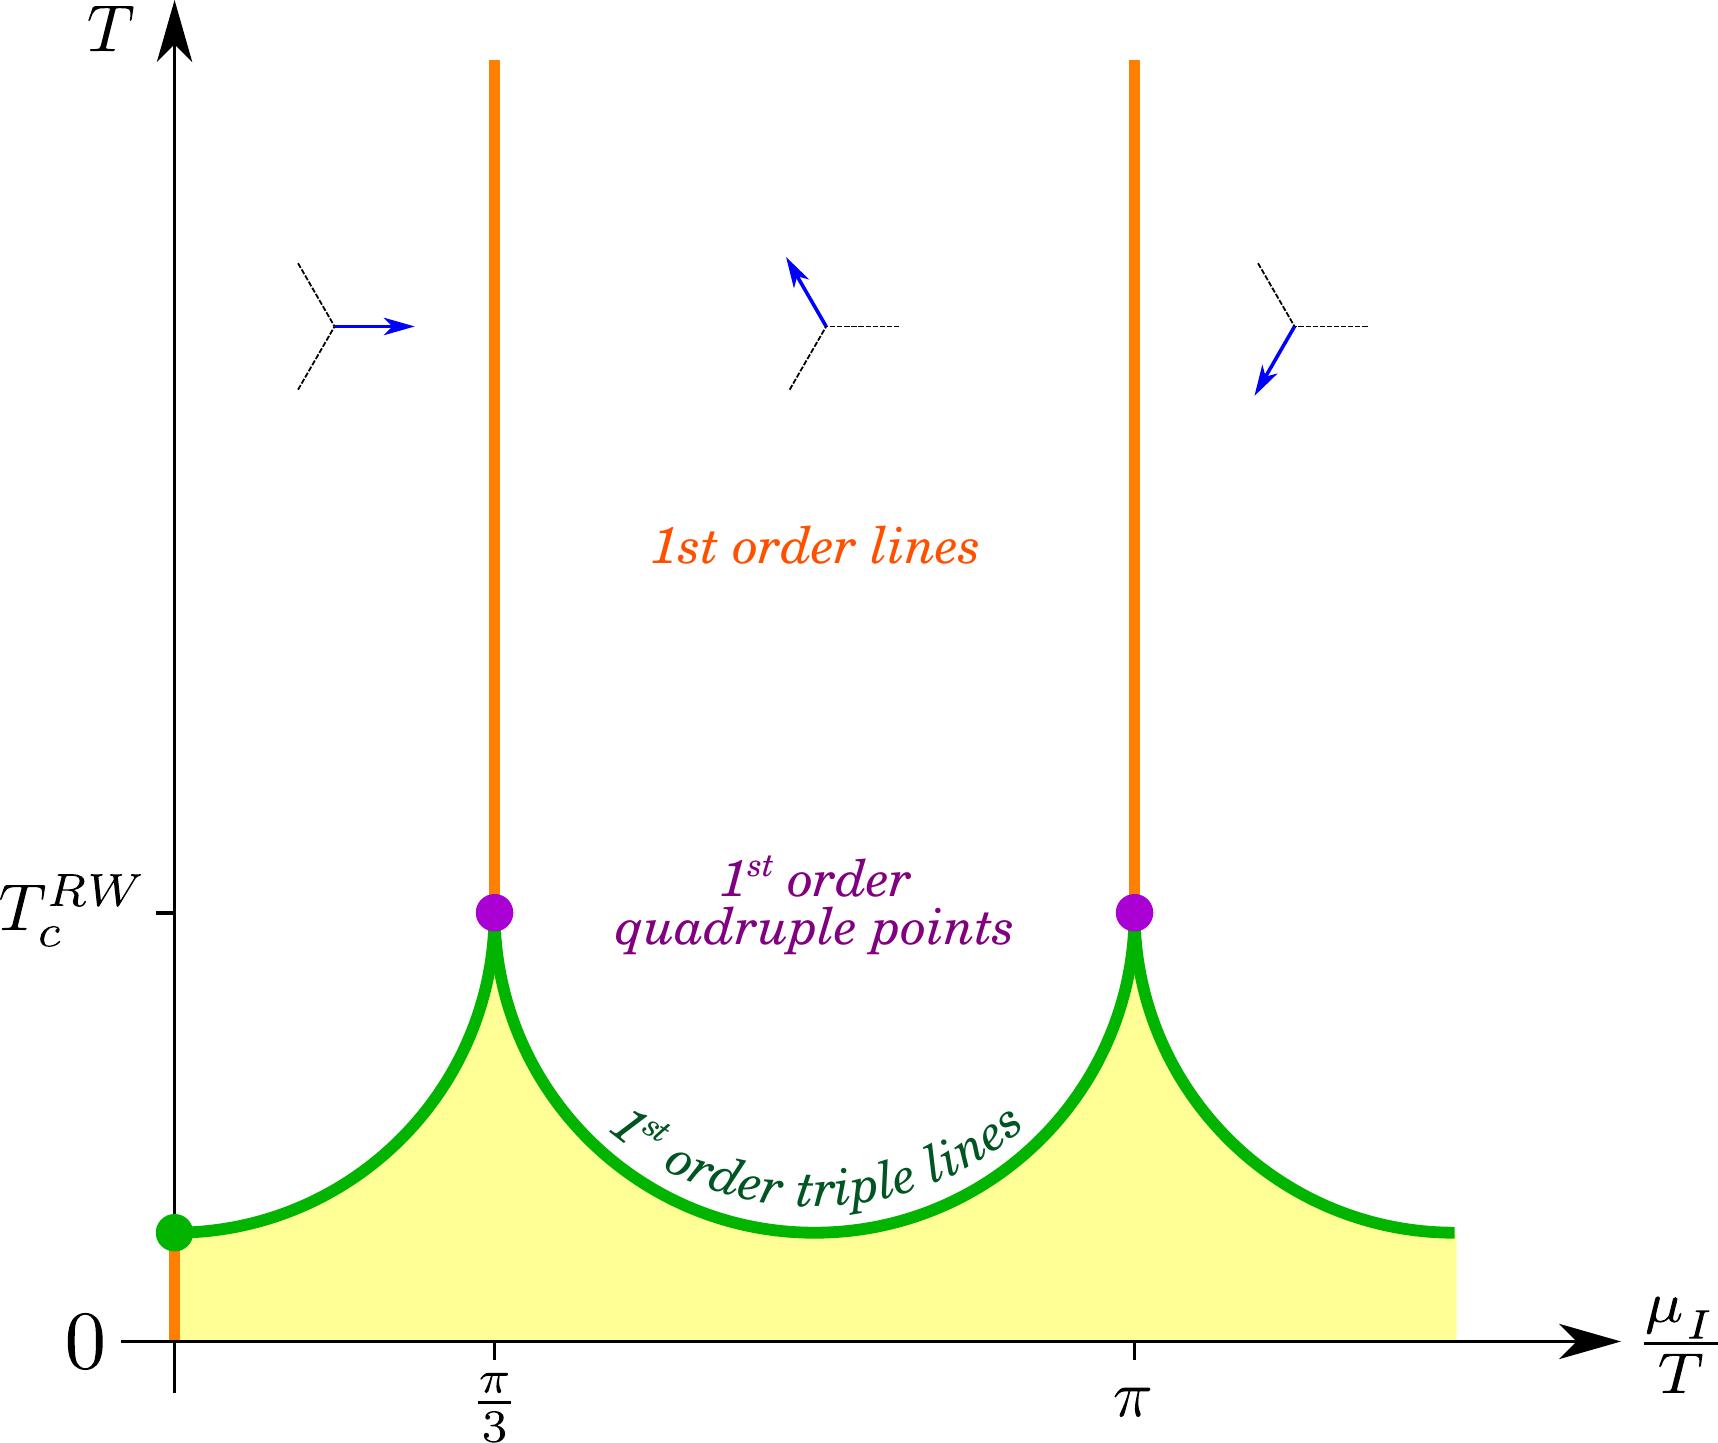
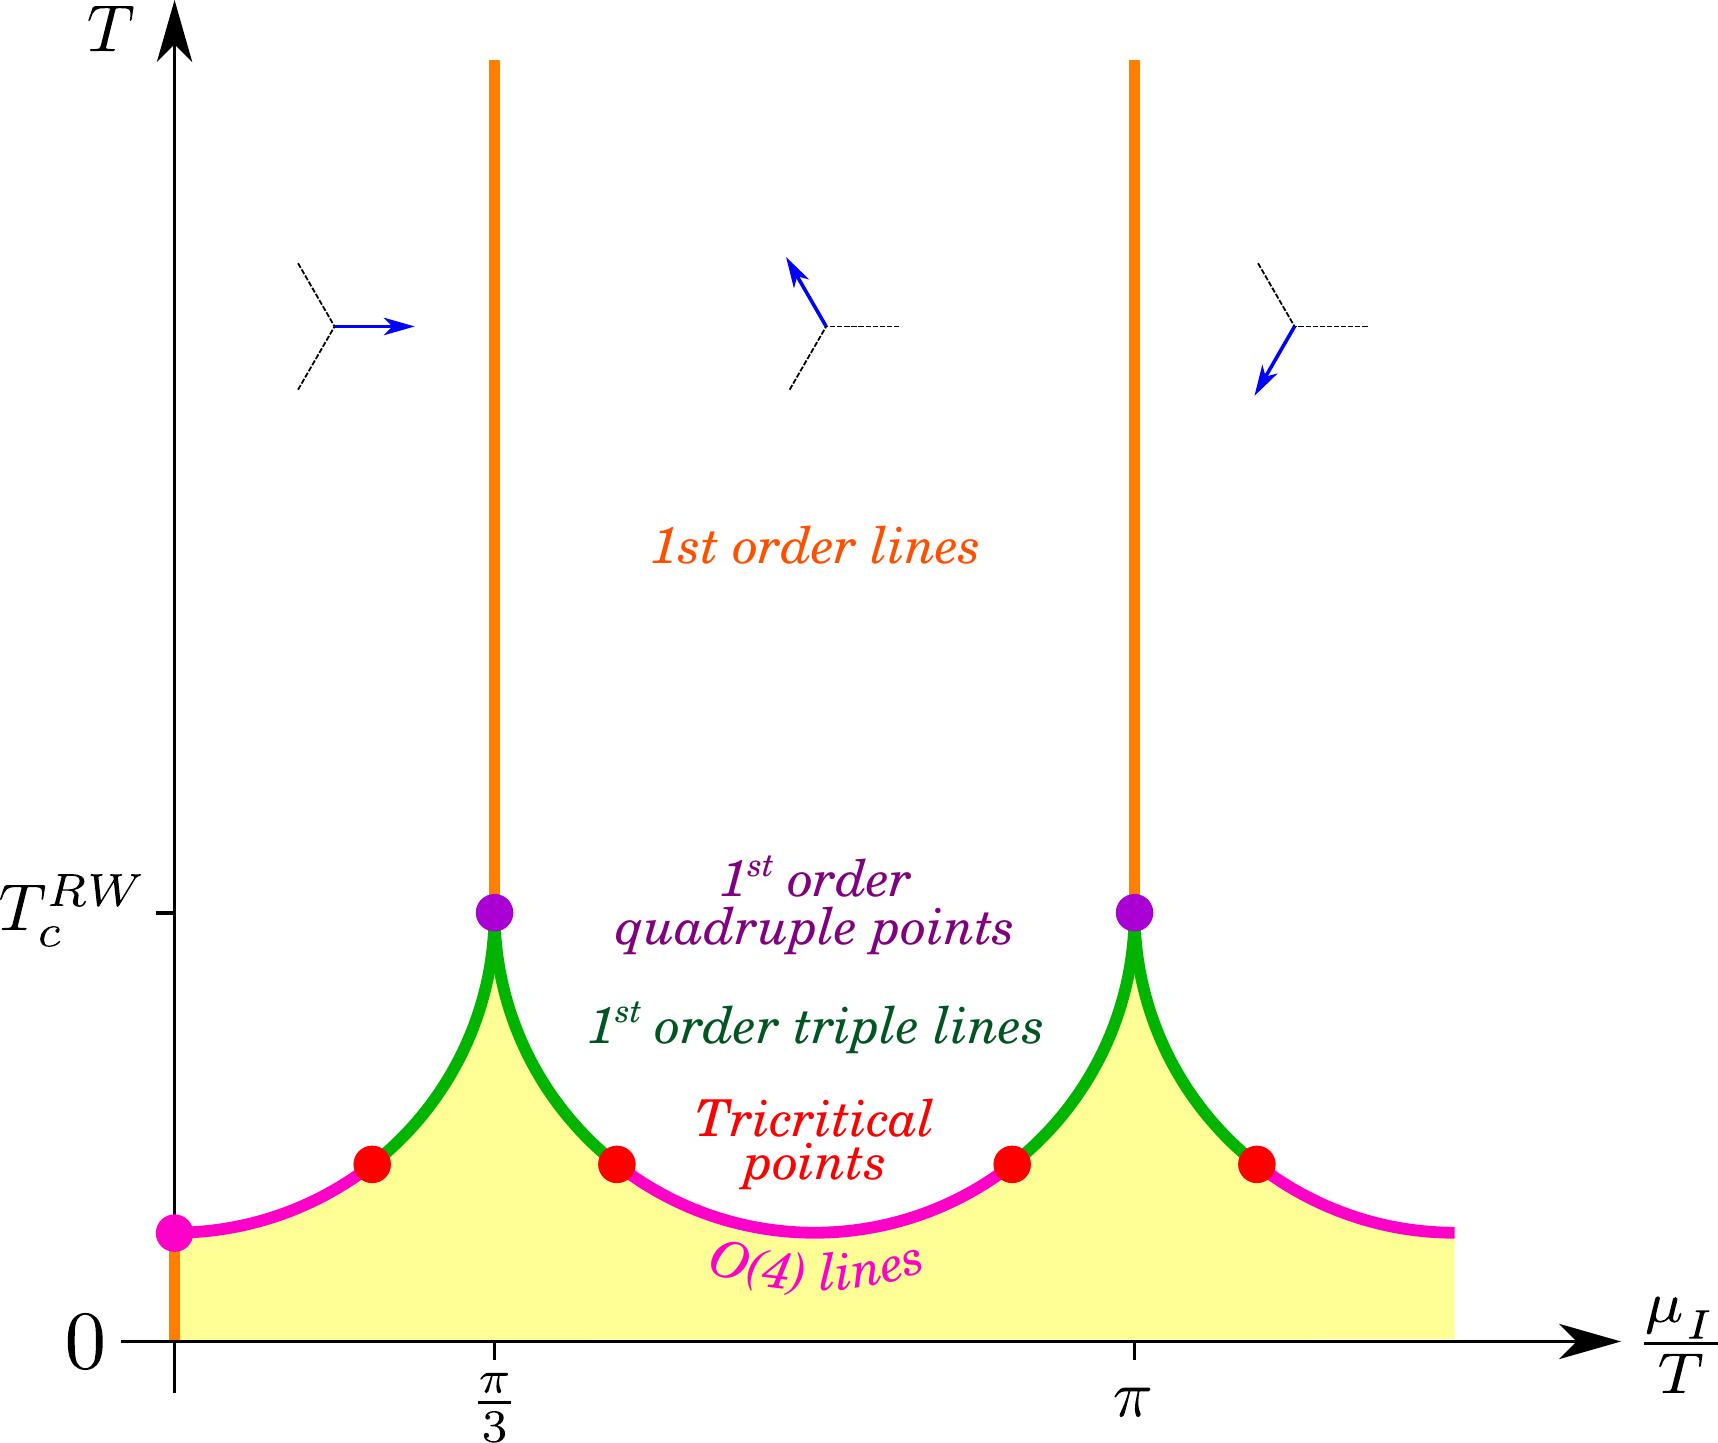
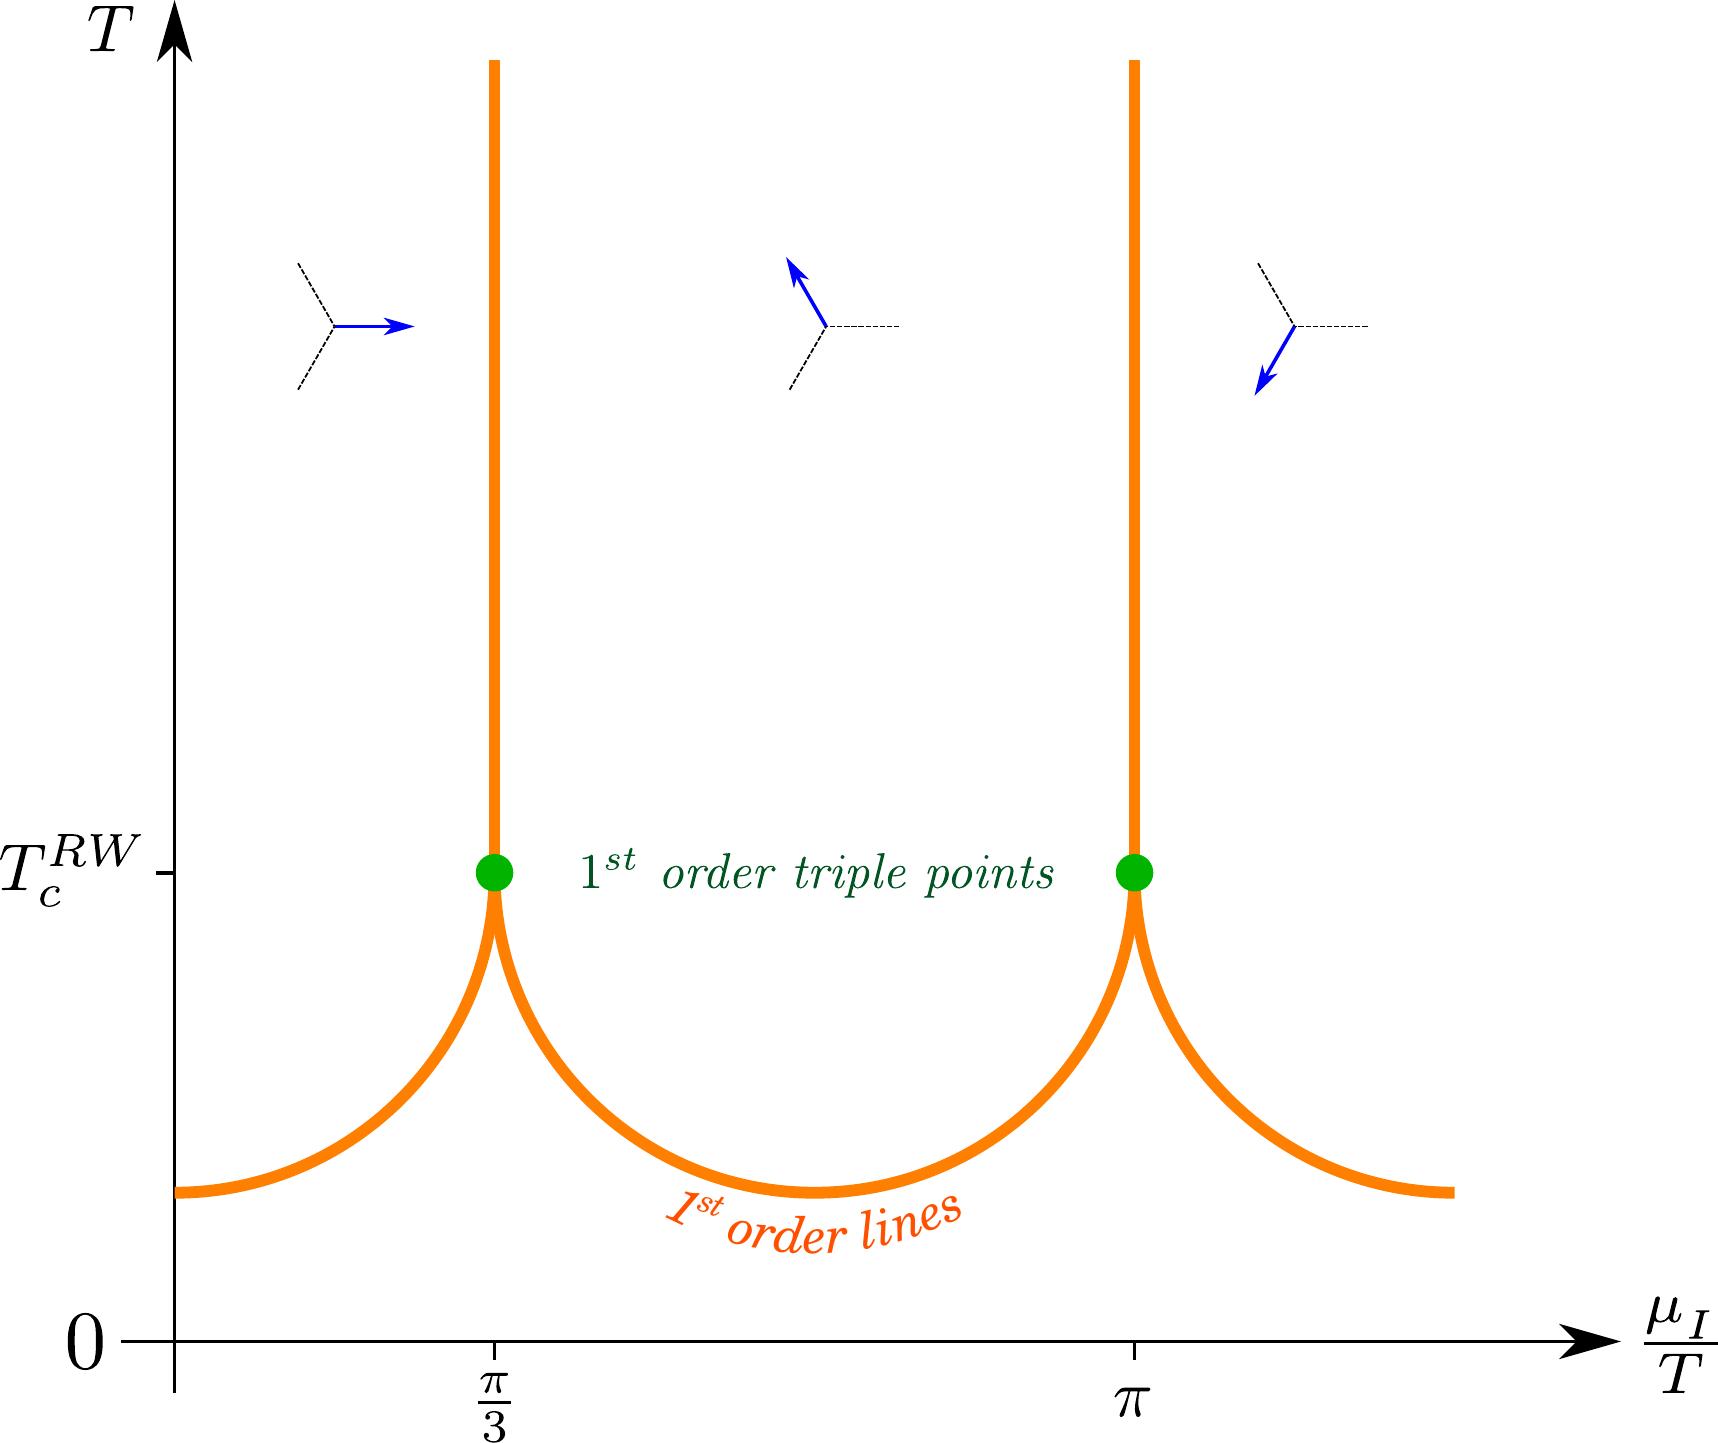
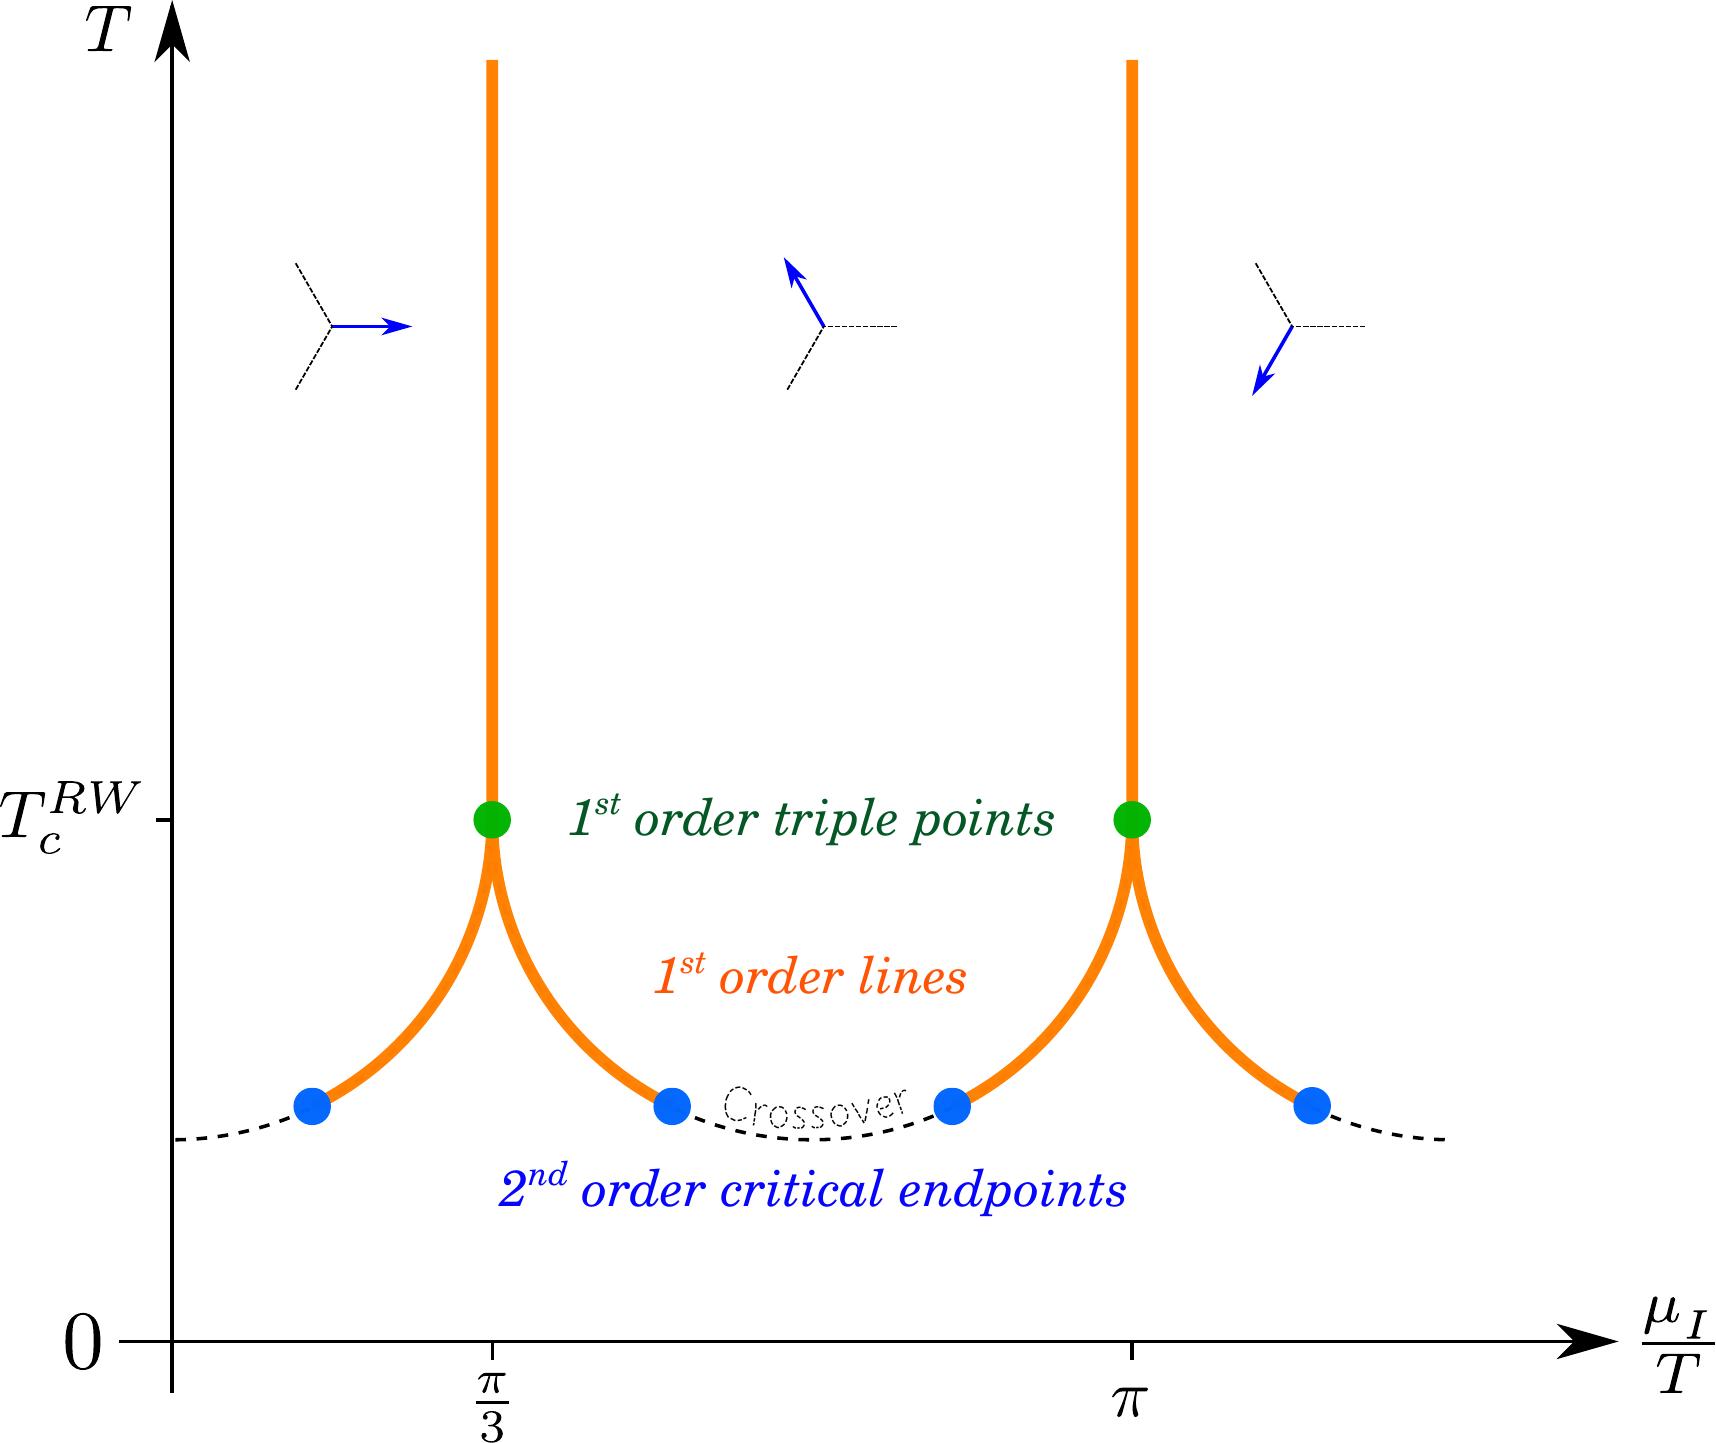
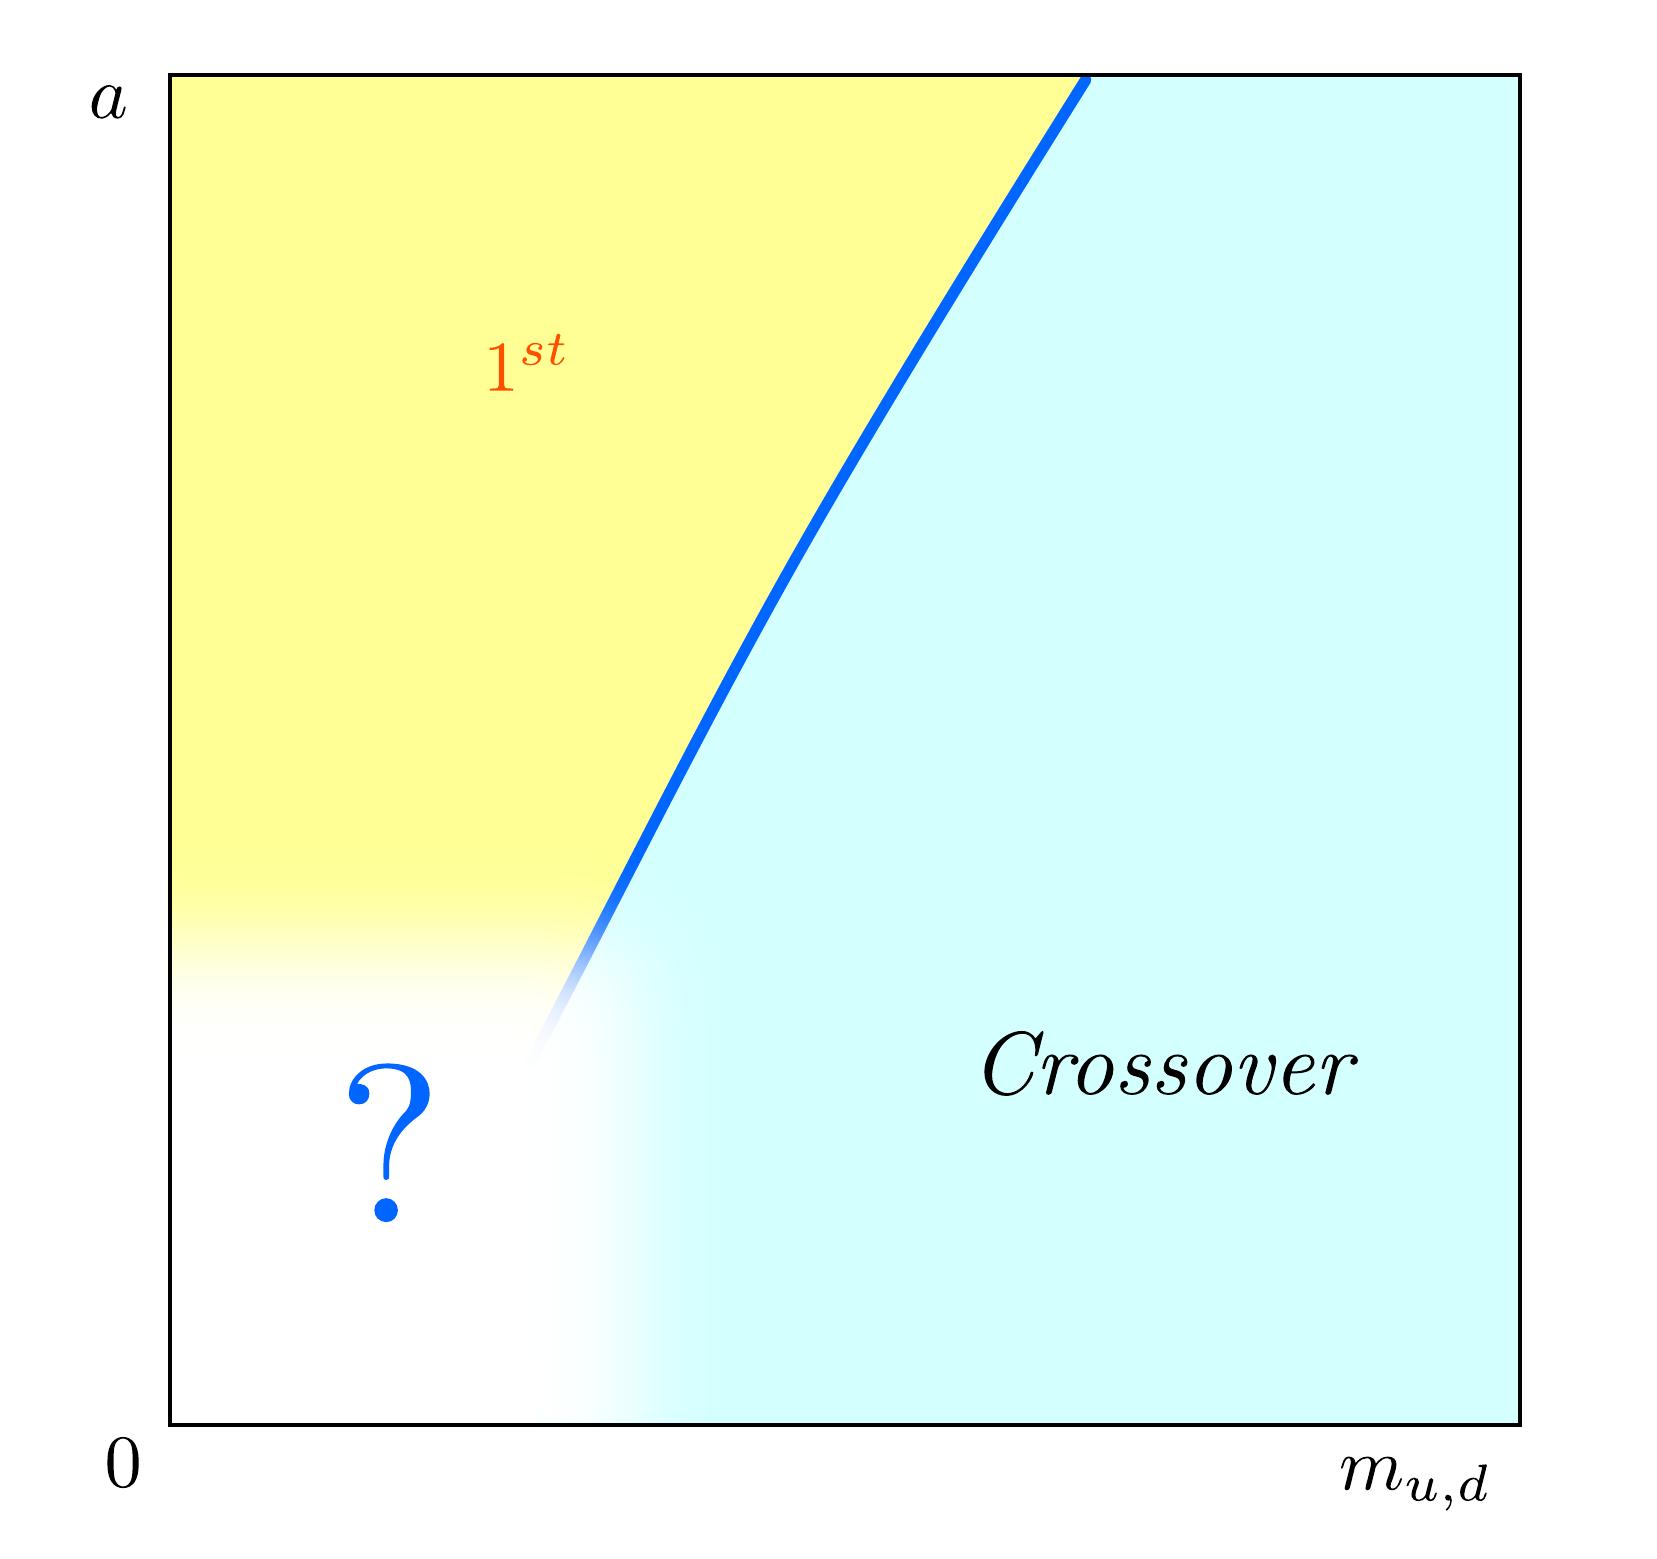
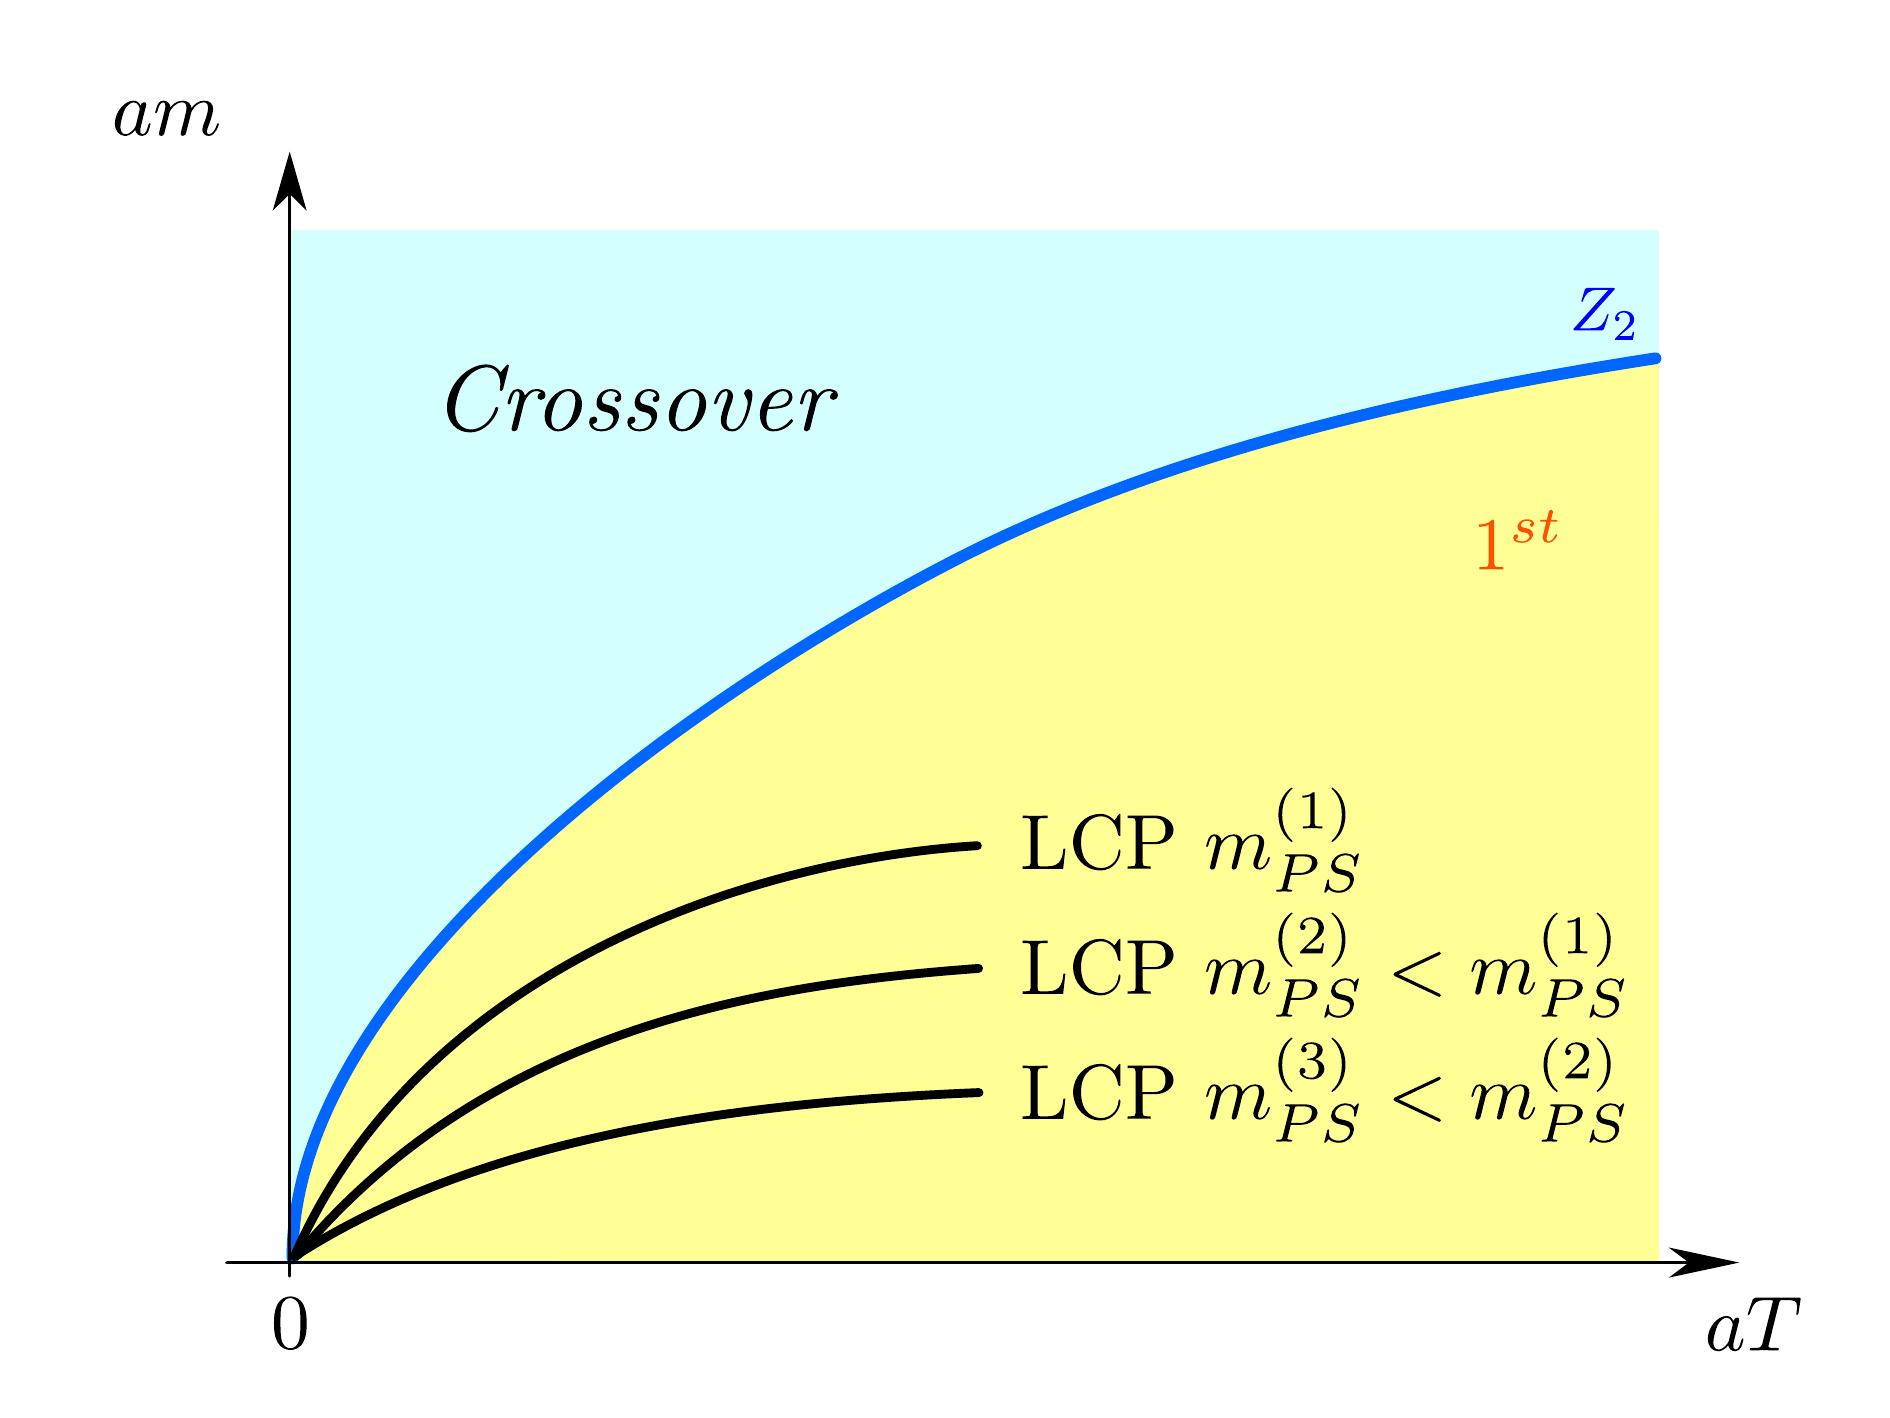
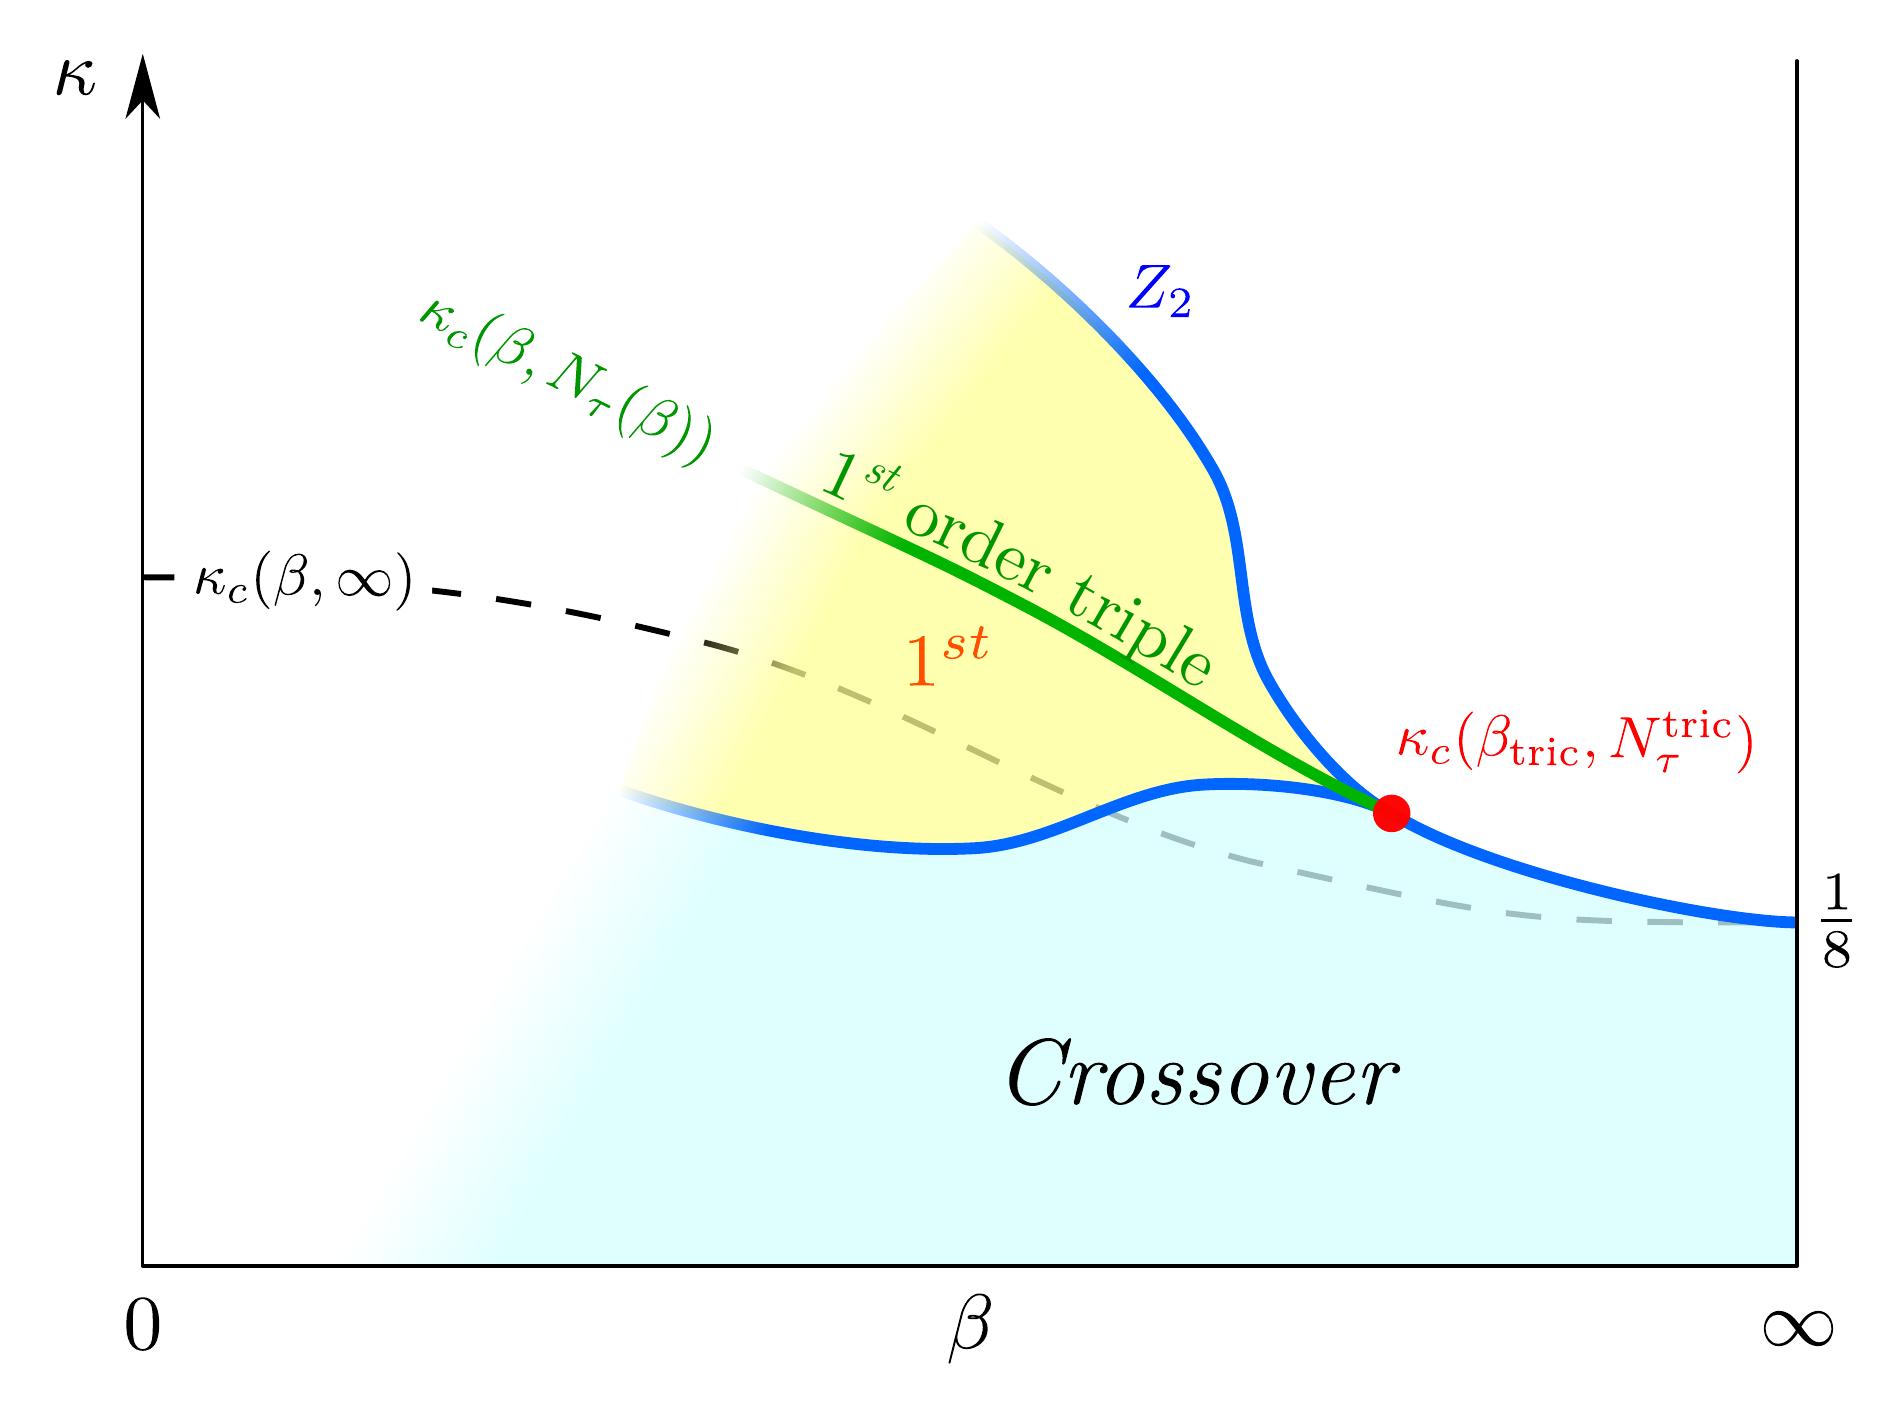
If the chiral first-order region is a lattice artefact for all values of the purely imaginary chemical potential, then it should vanish in the continuum limit.
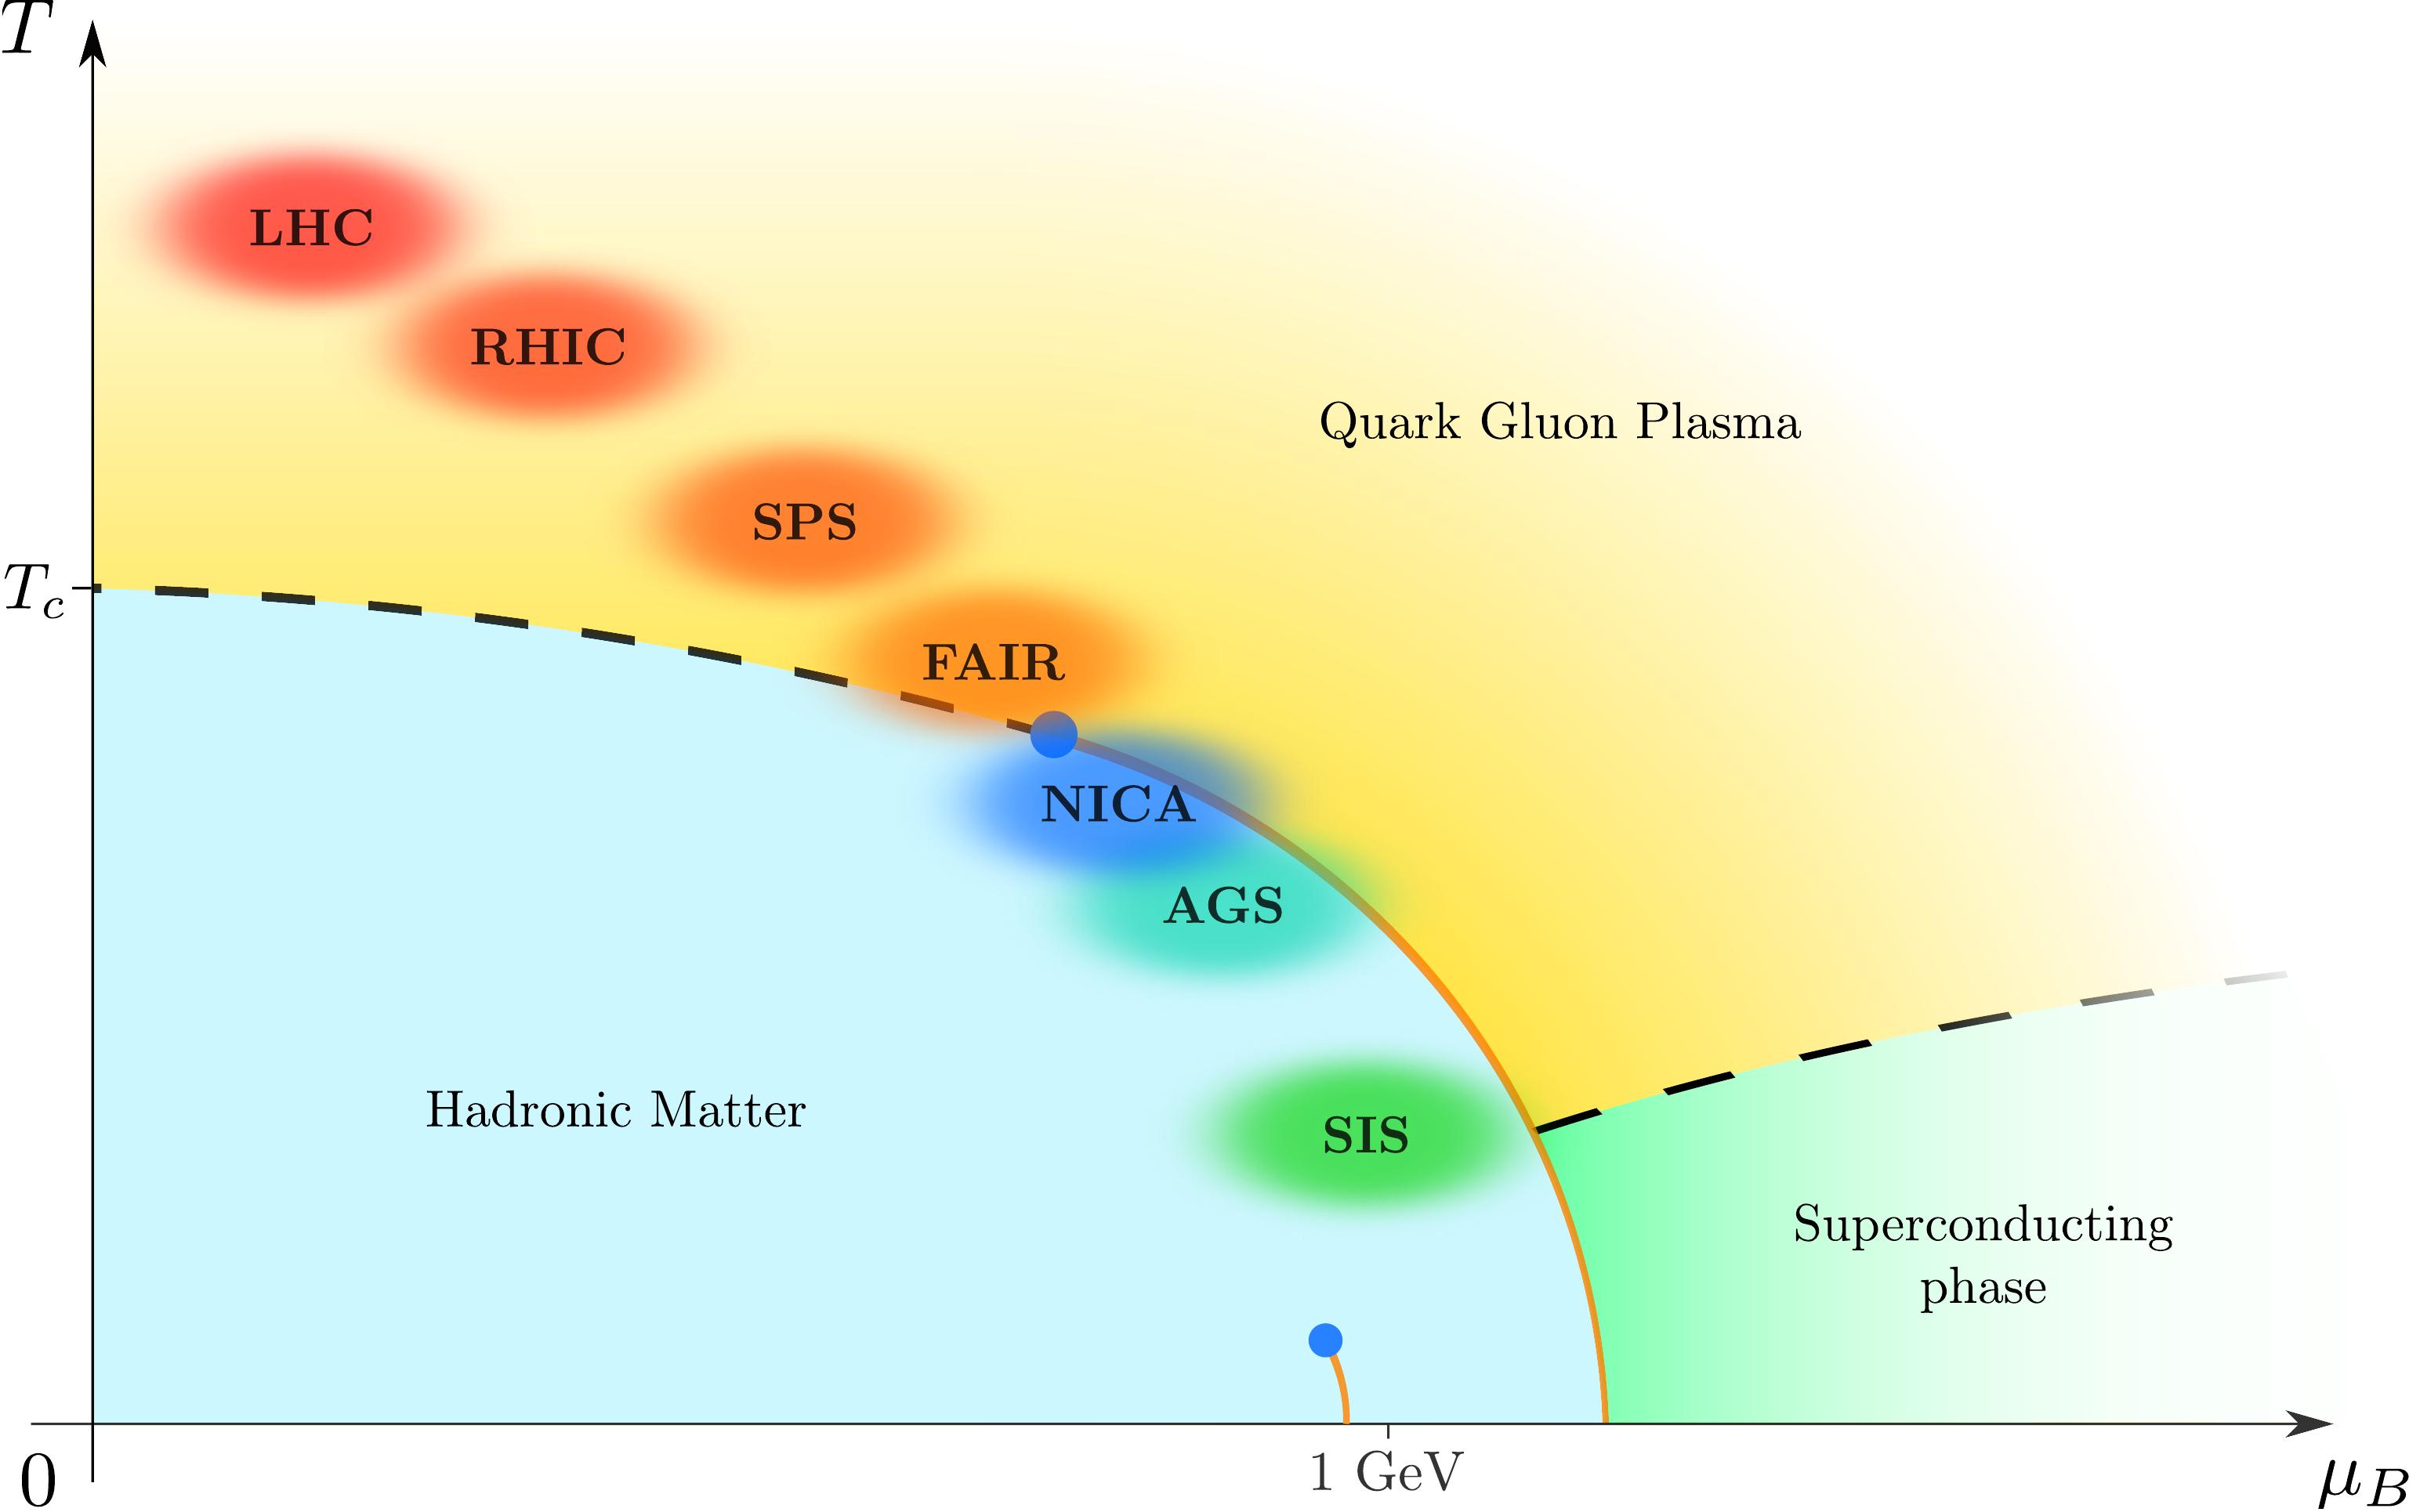
FAIR science!
By downloading any image and using it (possibly modified) in future publications, presentations, lectures and similar,
you undertake to give credit to the authors as appropriate.
By downloading any image and using it (possibly modified) in future publications, presentations, lectures and similar,
you undertake to give credit to the authors as appropriate.
By downloading any image and using it (possibly modified) in future publications, presentations, lectures and similar,
you undertake to give credit to the authors as appropriate.
Authors of this figure:
Alessandro Sciarra and
Francesca Cuteri.
By downloading any image and using it (possibly modified) in future publications, presentations, lectures and similar,
you undertake to give credit to the authors as appropriate.
Authors of this figure:
Alessandro Sciarra and
Francesca Cuteri.
By downloading any image and using it (possibly modified) in future publications, presentations, lectures and similar,
you undertake to give credit to the authors as appropriate.
By downloading any image and using it (possibly modified) in future publications, presentations, lectures and similar,
you undertake to give credit to the authors as appropriate.
By downloading any image and using it (possibly modified) in future publications, presentations, lectures and similar,
you undertake to give credit to the authors as appropriate.
By downloading any image and using it (possibly modified) in future publications, presentations, lectures and similar,
you undertake to give credit to the authors as appropriate.
By downloading any image and using it (possibly modified) in future publications, presentations, lectures and similar,
you undertake to give credit to the authors as appropriate.
By downloading any image and using it (possibly modified) in future publications, presentations, lectures and similar,
you undertake to give credit to the authors as appropriate.
By downloading any image and using it (possibly modified) in future publications, presentations, lectures and similar,
you undertake to give credit to the authors as appropriate.
By downloading any image and using it (possibly modified) in future publications, presentations, lectures and similar,
you undertake to give credit to the authors as appropriate.
By downloading any image and using it (possibly modified) in future publications, presentations, lectures and similar,
you undertake to give credit to the authors as appropriate.
By downloading any image and using it (possibly modified) in future publications, presentations, lectures and similar,
you undertake to give credit to the authors as appropriate.
By downloading any image and using it (possibly modified) in future publications, presentations, lectures and similar,
you undertake to give credit to the authors as appropriate.
By downloading any image and using it (possibly modified) in future publications, presentations, lectures and similar,
you undertake to give credit to the authors as appropriate.
By downloading any image and using it (possibly modified) in future publications, presentations, lectures and similar,
you undertake to give credit to the authors as appropriate.
By downloading any image and using it (possibly modified) in future publications, presentations, lectures and similar,
you undertake to give credit to the authors as appropriate.
By downloading any image and using it (possibly modified) in future publications, presentations, lectures and similar,
you undertake to give credit to the authors as appropriate.
By downloading any image and using it (possibly modified) in future publications, presentations, lectures and similar,
you undertake to give credit to the authors as appropriate.
By downloading any image and using it (possibly modified) in future publications, presentations, lectures and similar,
you undertake to give credit to the authors as appropriate.
By downloading any image and using it (possibly modified) in future publications, presentations, lectures and similar,
you undertake to give credit to the authors as appropriate.
By downloading any image and using it (possibly modified) in future publications, presentations, lectures and similar,
you undertake to give credit to the authors as appropriate.
By downloading any image and using it (possibly modified) in future publications, presentations, lectures and similar,
you undertake to give credit to the authors as appropriate.
By downloading any image and using it (possibly modified) in future publications, presentations, lectures and similar,
you undertake to give credit to the authors as appropriate.
By downloading any image and using it (possibly modified) in future publications, presentations, lectures and similar,
you undertake to give credit to the authors as appropriate.
By downloading any image and using it (possibly modified) in future publications, presentations, lectures and similar,
you undertake to give credit to the authors as appropriate.
By downloading any image and using it (possibly modified) in future publications, presentations, lectures and similar,
you undertake to give credit to the authors as appropriate.
By downloading any image and using it (possibly modified) in future publications, presentations, lectures and similar,
you undertake to give credit to the authors as appropriate.
By downloading any image and using it (possibly modified) in future publications, presentations, lectures and similar,
you undertake to give credit to the authors as appropriate.
By downloading any image and using it (possibly modified) in future publications, presentations, lectures and similar,
you undertake to give credit to the authors as appropriate.
By downloading any image and using it (possibly modified) in future publications, presentations, lectures and similar,
you undertake to give credit to the authors as appropriate.
By downloading any image and using it (possibly modified) in future publications, presentations, lectures and similar,
you undertake to give credit to the authors as appropriate.
By downloading any image and using it (possibly modified) in future publications, presentations, lectures and similar,
you undertake to give credit to the authors as appropriate.
By downloading any image and using it (possibly modified) in future publications, presentations, lectures and similar,
you undertake to give credit to the authors as appropriate.
